Big data can be used by the operator for the following scenarios:
- Understand the traffic structure by protocols and applications and its dynamics to form attractive tariff plans, identify peering points and optimize routes.
- Monitor the quality of applinks for specific applications and quickly react to problems with traffic from the WAN network.
- Identify problem subscribers based on latency and packet re-requests to troubleshoot and improve subscriber loyalty.
- Proactively monitor cyber threats based on subscriber call statistics using the Kaspersky feed database to reduce the number of BotNet on the network.
- Monitor DDoS attacks and react to traffic spikes in time.
3 minutes to build a report on 1 petabyte of data
Let’s consider the example of an operator with 1 million subscribers. In our experience, it is assumed that an operator of this size has about 2 Tbps of peak traffic.
To work with typical business cases operators:
- Store ‘raw’ IPFIX statistics for 24 hours, which is approximately 45 TB.
- Then, using Stor’s QoE algorithms, the data is aggregated for storage and is reduced by a factor of 5. Aggregated data is typically stored for 3 months, which is about 900 TB .
Combined with other types of data (e.g. NAT log or GTP log), our reference operator comes out to about 1 petabyte .
However, it is not only important to get the data, but also to make sure it is available and processed quickly. The operator’s engineers and marketing specialists work with them every day: they build reports on various fields and filters for the entire depth of data storage. For comfortable work of users the time of building reports by filters should not exceed 3 minutes .
Also data from the database are used on a regular basis to send periodic reports to the operator’s services by e-mail/telegram and to build dashboards.
You can calculate the volume of your operator’s statistics using the calculator.
Solution Components
Data acquisition takes place in several stages:
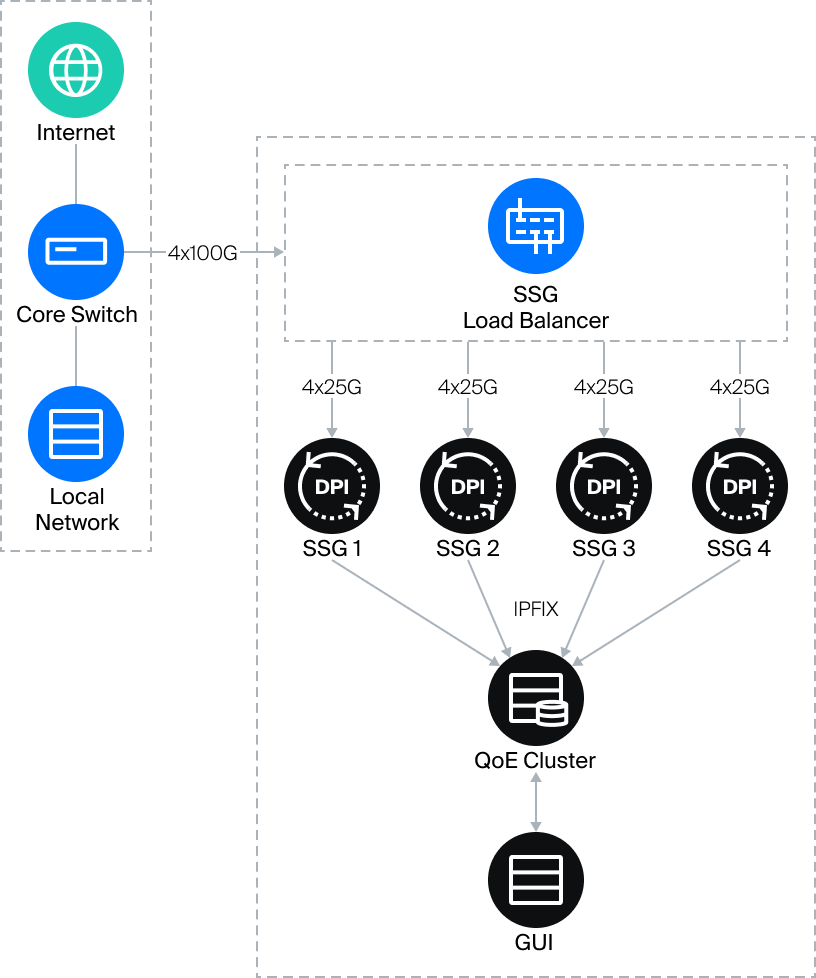
- Passing traffic through SSG in order to analyze it by signature (protocols and applications).
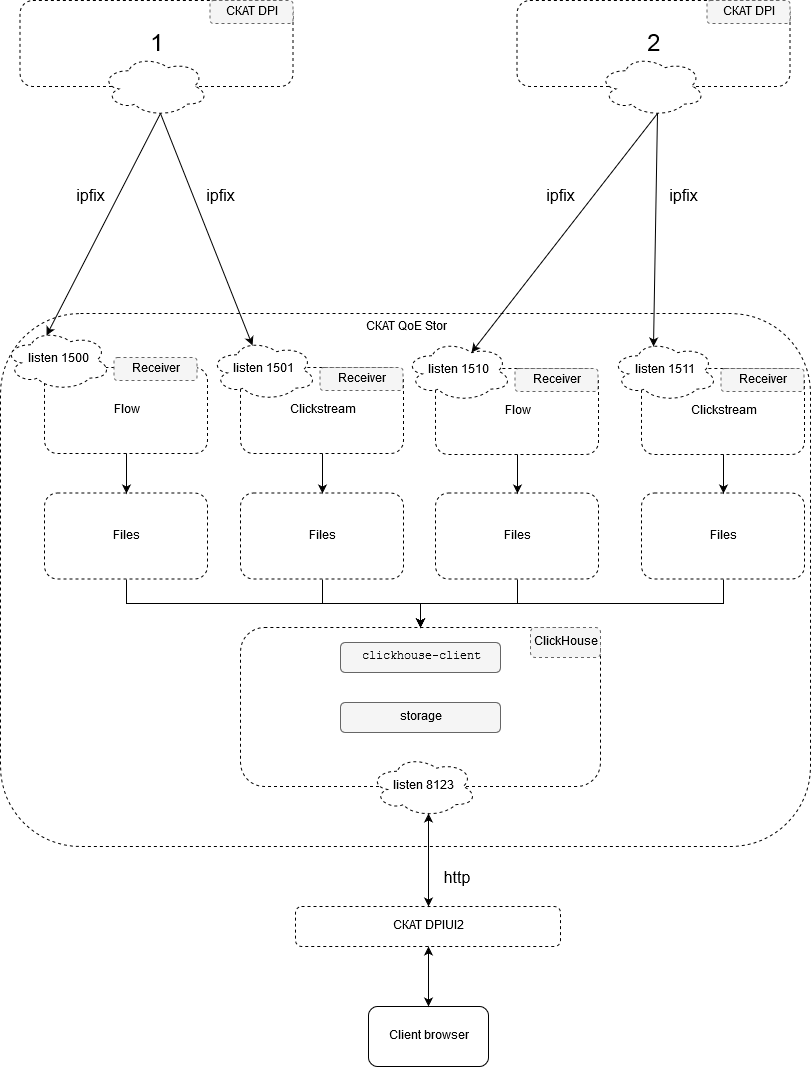
- Sending statistics from SSG via IPFIX protocol (NetFlow v10), which is performed via ipfixcol2 balancer in order to evenly distribute statistics across nodes and to provide fault tolerance in case of one node failure.
- Receiving statistics on QoE Stor using ipfixreceiver2.
In case the traffic volume is larger than a single SSG can handle, a DPI cluster is used. The traffic is extracted from the central part of the network and sent to the SSG Load Balancer, which distributes the load evenly among several SSG servers. The load balancer is capable of handling up to 800 Gbps of mirrored traffic.
More detailed information about Load Balancer operation can be found in our knowledge base.
QoE Cluster
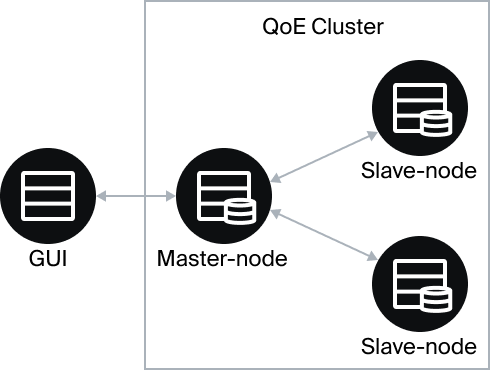
QoE Stor basically uses a ClickHouse database with the ability to create a cluster of multiple nodes:
- A master-node is assigned to the cluster, which receives a request from the GUI and sends requests to the slave-node.
- Each slave-node creates a report based on its own data and sends it to the master-node.
- The master-node aggregates the received responses from the slave-node and makes the resulting representation for visualization in the GUI.
This hierarchy allows to realize linear scaling of the cluster when new nodes are added without having to ramp up the performance of the master-node. GUI works with the cluster in a special mode (enabled by a separate option in the settings), modifying SQL queries so that nodes build reports ready for gluing. Without this mode, the cluster is just a distributed storage, and performance is limited only by master-node performance and network bandwidth between QoE nodes.
QoE Stor performs data processing in several stages:
- ipfixreceiver2 receives and writes raw data to a text file with a specified frequency (10 sec.-10 min.) to the default-disk.
- The post-process performs aggregation of raw data in order to reduce storage space and fill tables for building reports. The aggregation step lasts from 1 minute to 1 hour.

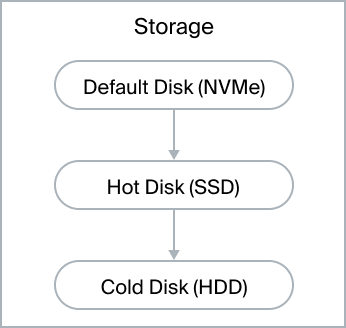
Several types of disks are used to optimize storage cost:
- default – fast disks for receiving data and performing the aggregation process, NVMe SSDs are recommended.
- hot – disks for storage during the period when there will be a high probability of requesting reports on this data, usually up to 3 months.
- cold – slow disks of large volume for long-term storage, it is recommended to use HDD.
Storage period on each level is set in the configuration via GUI. Moving data between disks and cleaning data is done automatically according to the settings. There is also an overflow control mechanism to protect the database.
For more information about the advantages of Stingray Service Gateway and QoE analytics module, please contact VAS Experts. Leave a request for testing to objectively evaluate the capabilities and functionality of the software.


