QoE Analytics

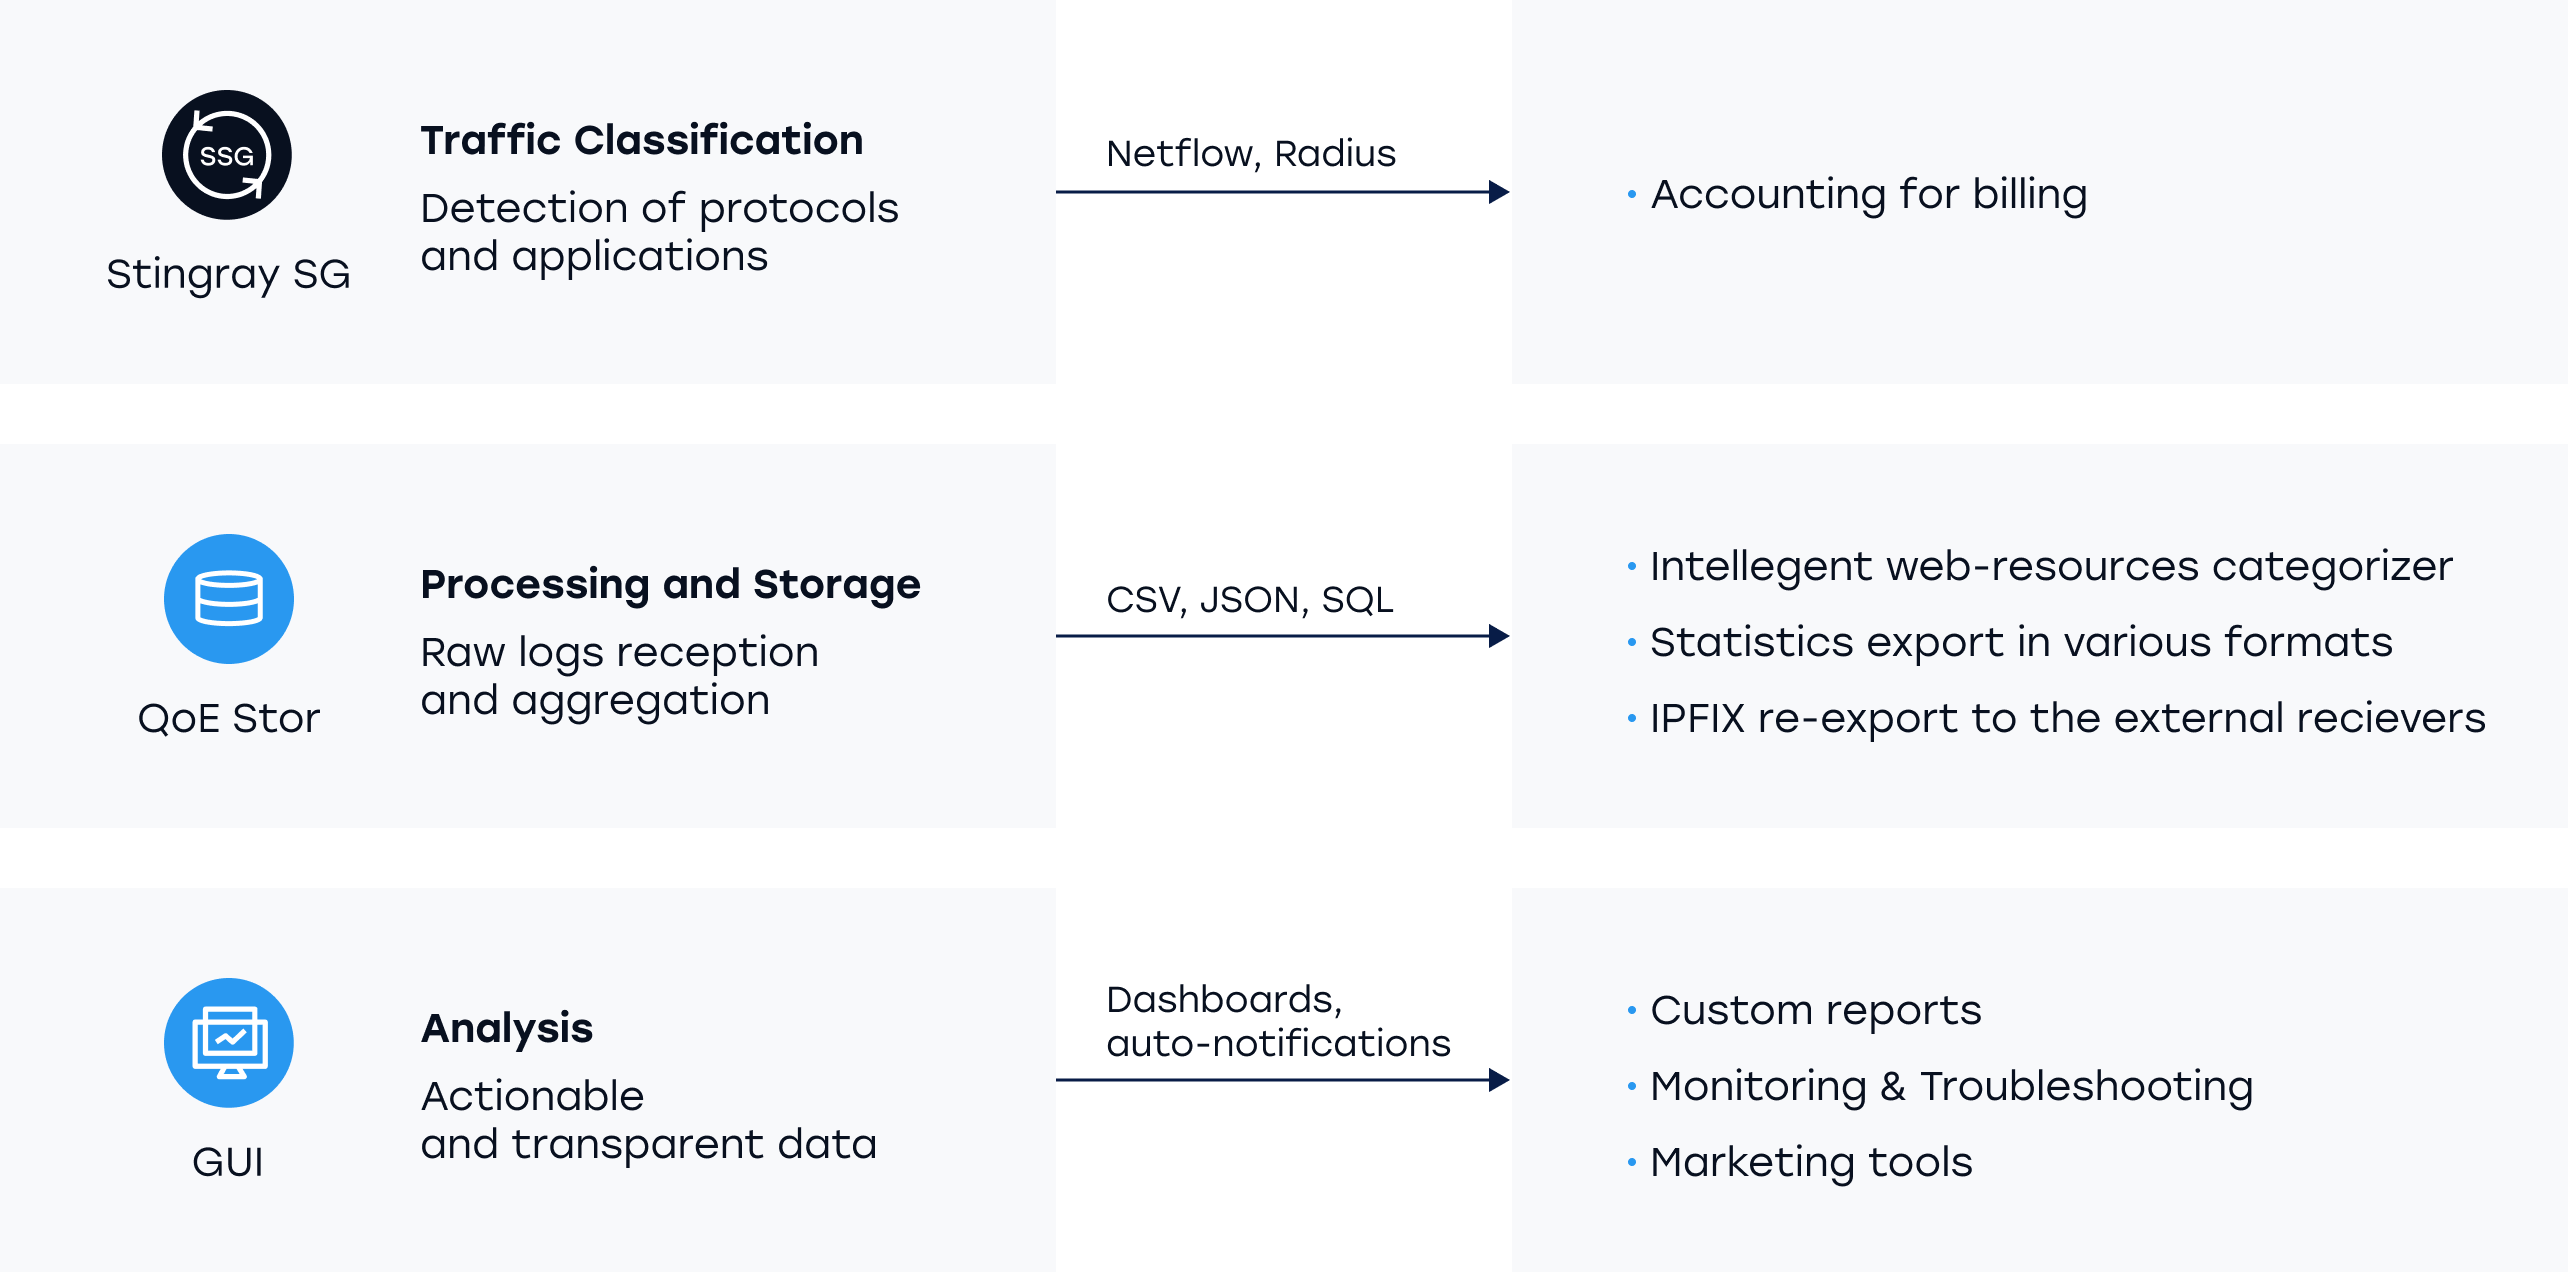
Quality of Experience (QoE) is a software product responsible for gathering statistics and evaluating subscribers’ perception of services. DPI-based QoE metrics help to increase customer loyalty, monitor the network and increase ARPU from each subscriber.

Service Description

The statistics are transferred to special metrics that allow user experience evaluation. It provides the operator with the information: whether the subscriber gets high-quality Internet communication or not; what kind of problems does he/she encounter.

The data obtained allow the operator to take action and to improve the quality of the services – resulting in increased customer loyalty.

With QoE, you can monitor your network state in automated mode, compiling all the necessary information – subscribers’ data, devices in use, tariff plans, etc. – integrally. The entire compilation or parts of it can be forwarded to various back-office Depts., namely Tech, Sales or Marketing, for more efficient operations.

Based on the precise data rather than on even the best guesses, it is easier for a provider to make optimal decisions. Which, in the end, results in ROI and ARPU growth.

The key metrics are:

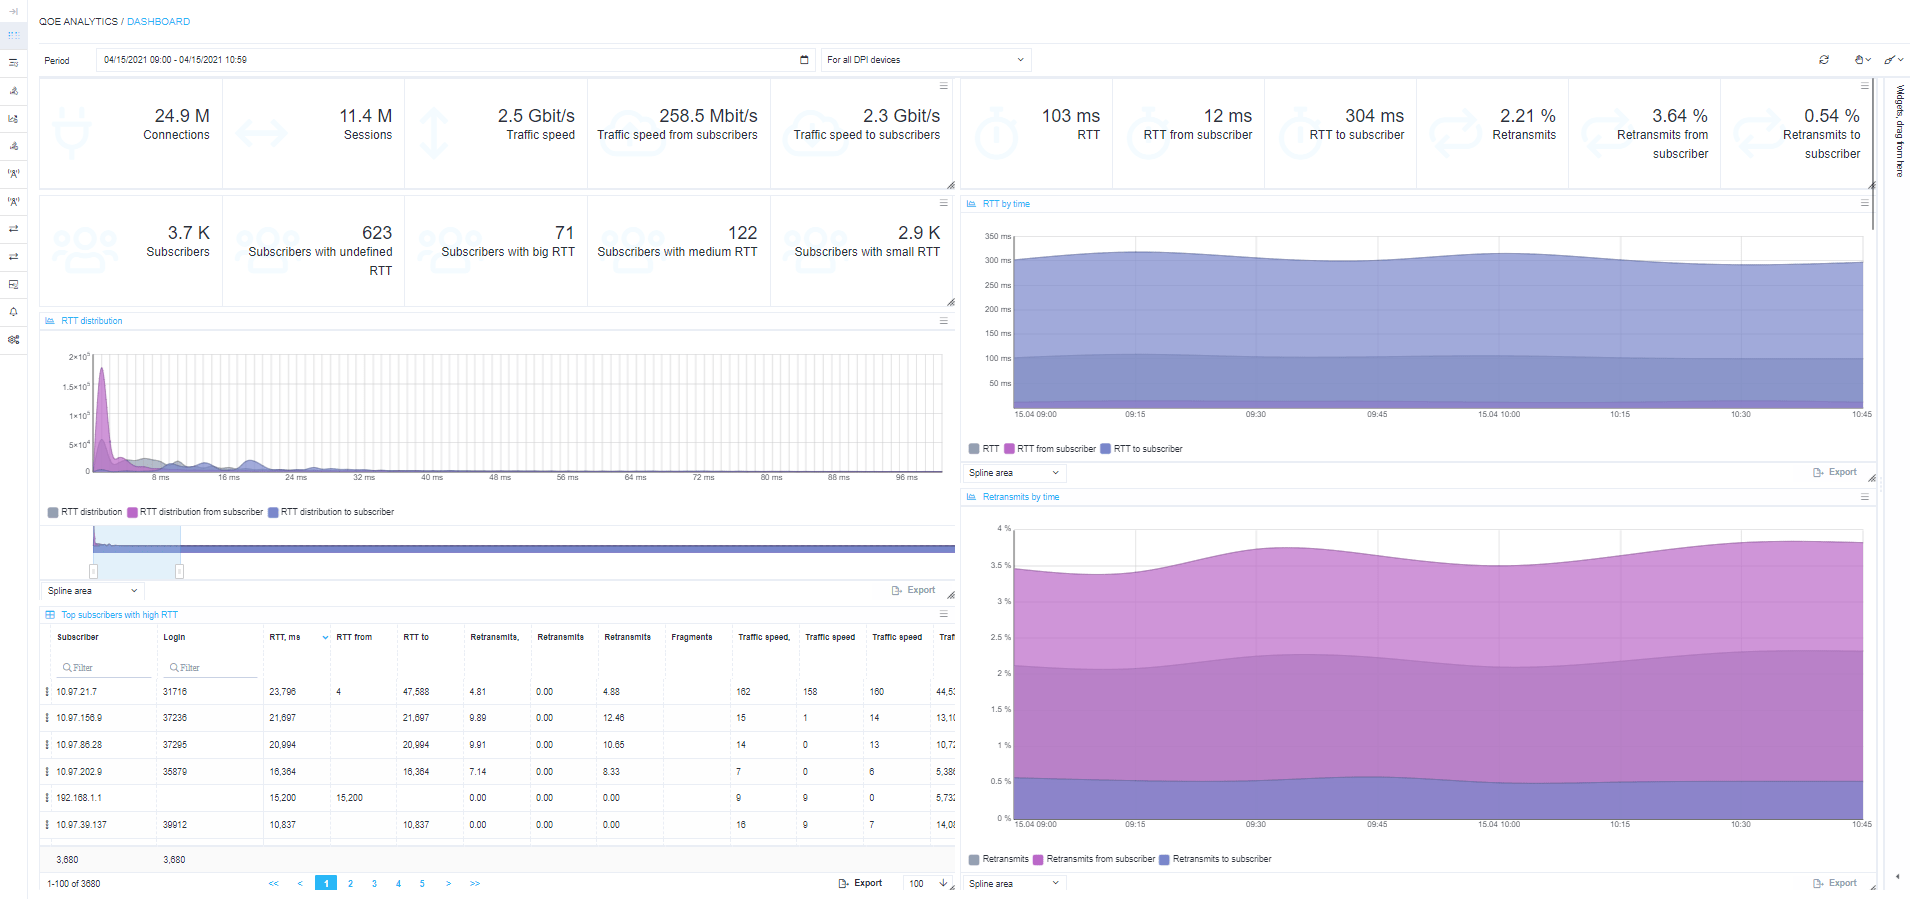
  • Round-trip-time (RTT)
  • Indicators of retries number
  • The number of sessions, devices, agents
  • IP-addresses per subscribe
  • Traffic distribution by application and transport protocols
  • Traffic distribution by autonomous system (AS) numbers
  • Clickstream for each subscriber

Levels of analytics

Analytics levels

Features

Round-trip-time (RTT)

Delay statistics: from the subscriber to the subscriber, the entire path and median.

  • Searching for subscribers with high delays and poor connection quality.
  • Searching for problems with client equipment, Wi-Fi routers, access and aggregation switches.
  • Using API for exporting data into the monitoring system.

Marketing campaigns

Redirecting the subscriber to a specific web page in a given period of time.

  • Automatic polling of subscribers upon tech support representative personal visit.
  • Notification of network crashes and reduction of load on tech support.
  • Notification of new services and special offers.

Clickstream

The number of sessions and subscribers’ devices, requests for Internet resources.

  • Identification of customers who left negative reviews; solving their issues.
  • Ability to reduce customer churn.

Number of retries

Retries statistics while accessing the Internet.

  • Searching for issues with Wi-Fi routers.
  • Selling Wi-Fi equipment with better performance and coverage.

Full NetFlow statistics’ export

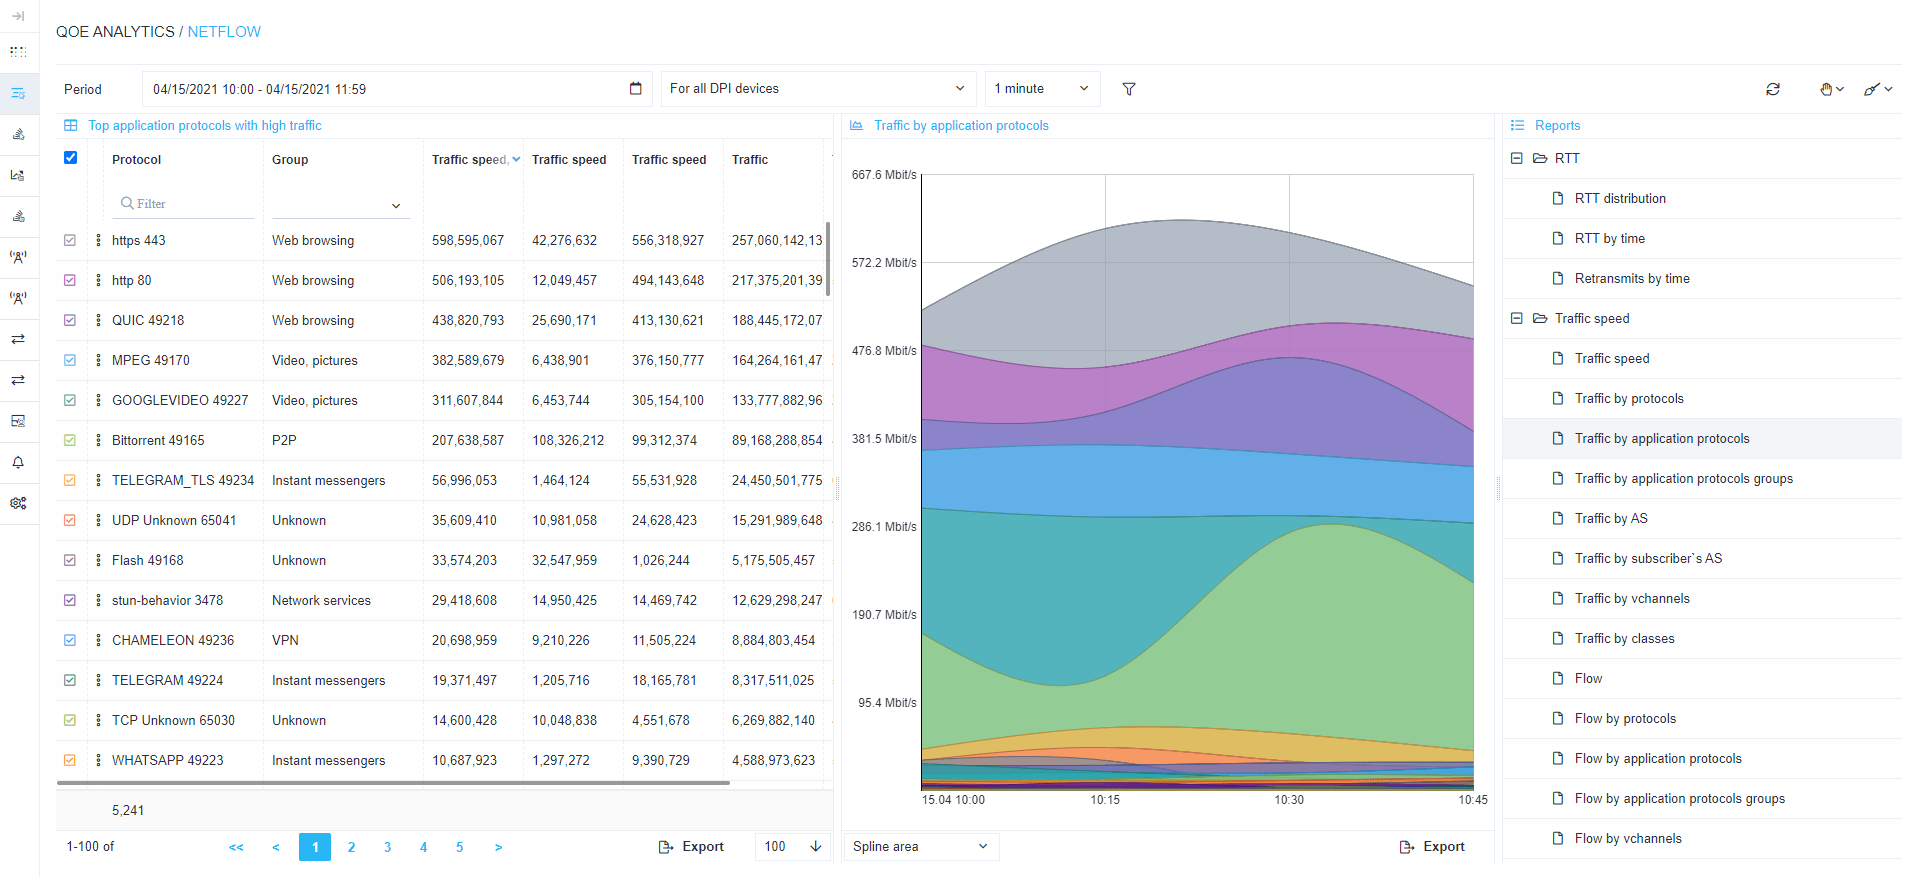
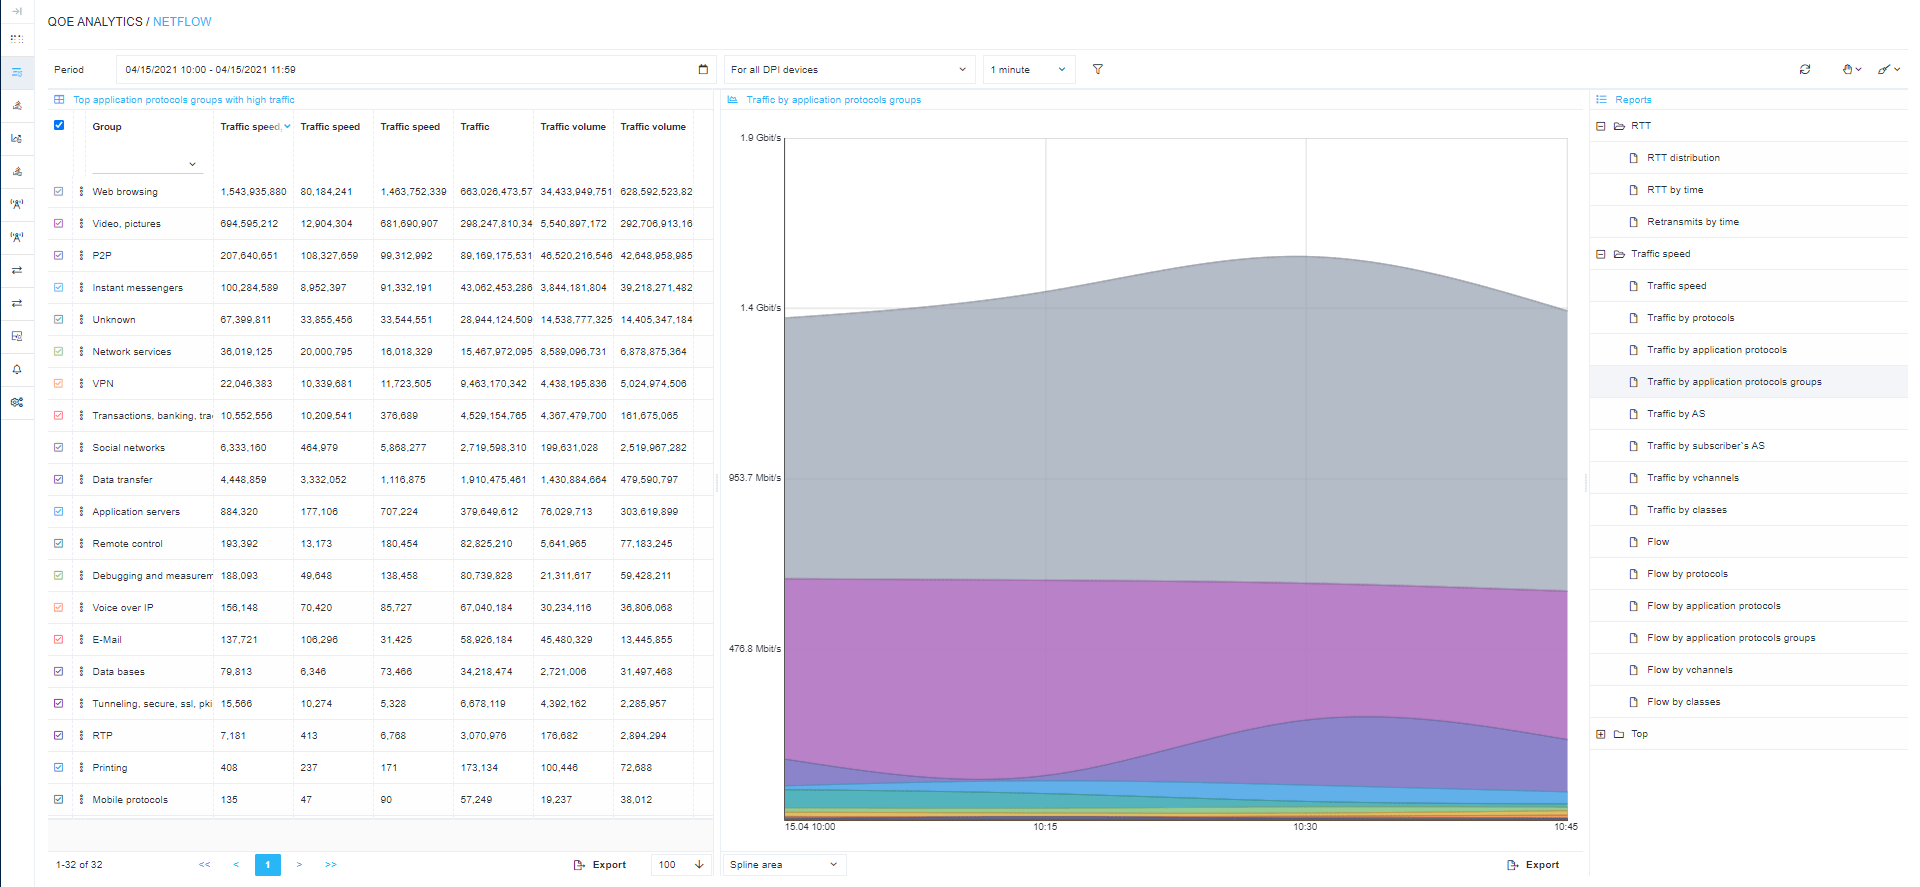
Statistics on transport and application protocols, traffic allocation depending on protocols and AS.

  • DPI prioritization setup depending on channel allocation.
  • Searching for optimal peering points and connections with upstream providers.
  • Tracking DDoS and virus attacks, development of techniques.

Graphical Interface

GUI Dashboard

NetFlow by Application Protocols

NetFlow by Group of Protocols

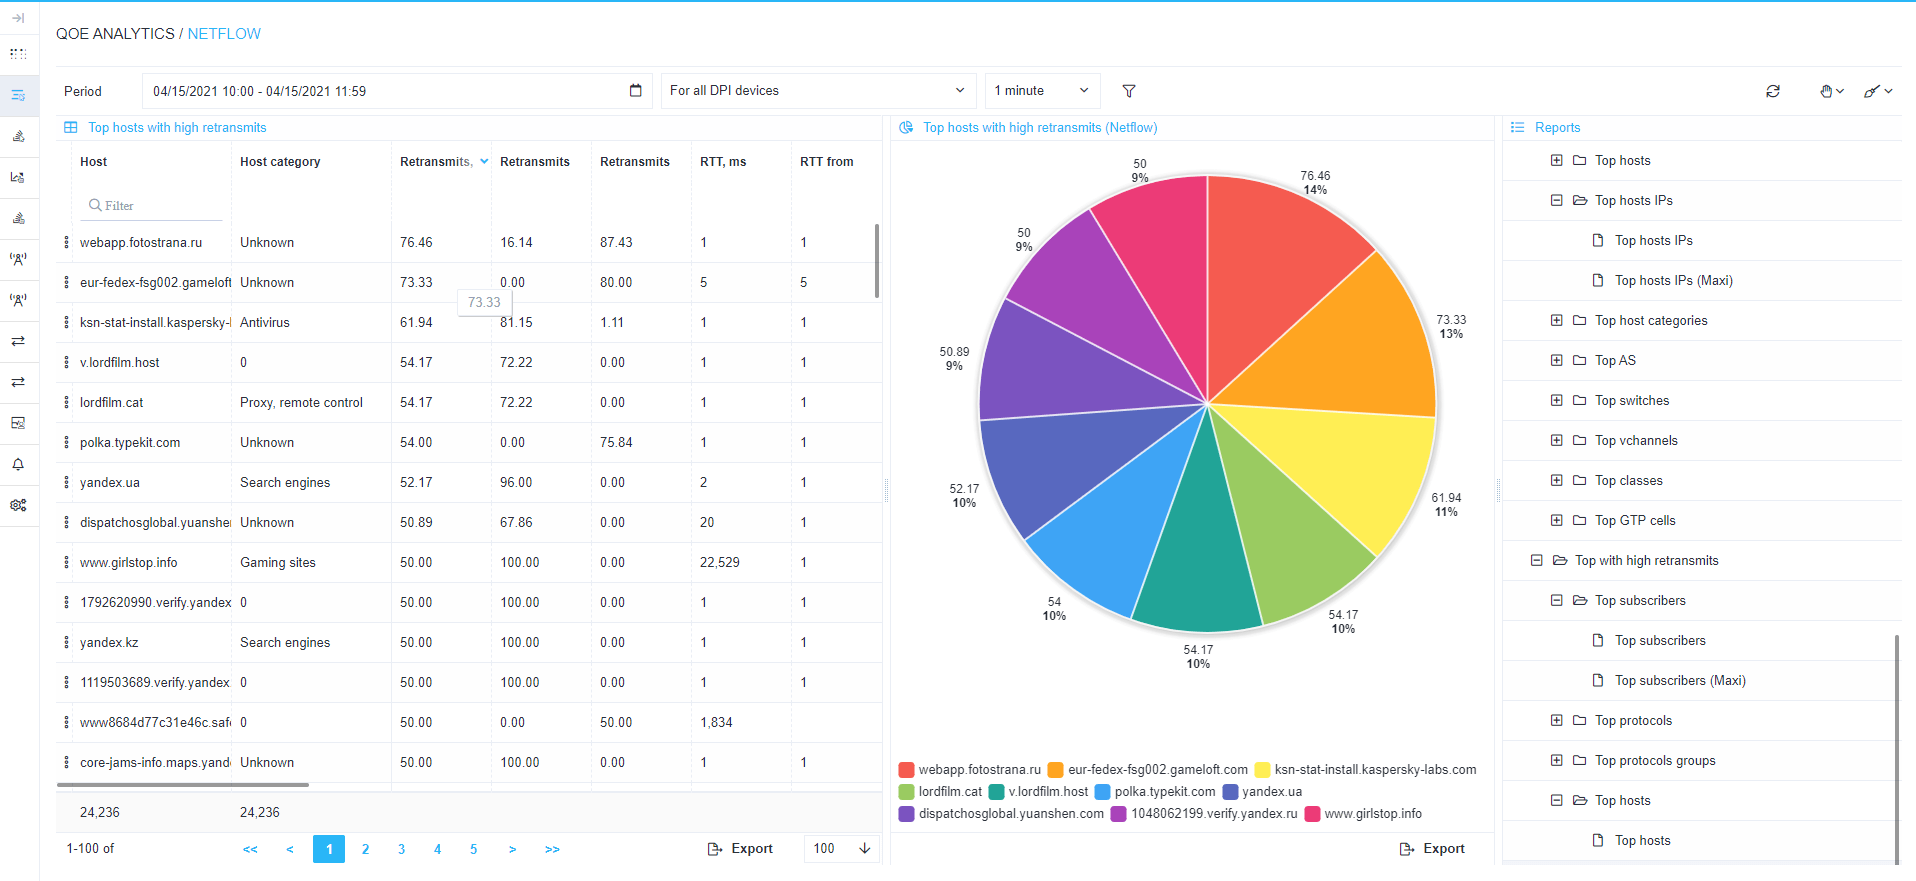
Top Hosts with Retransmits

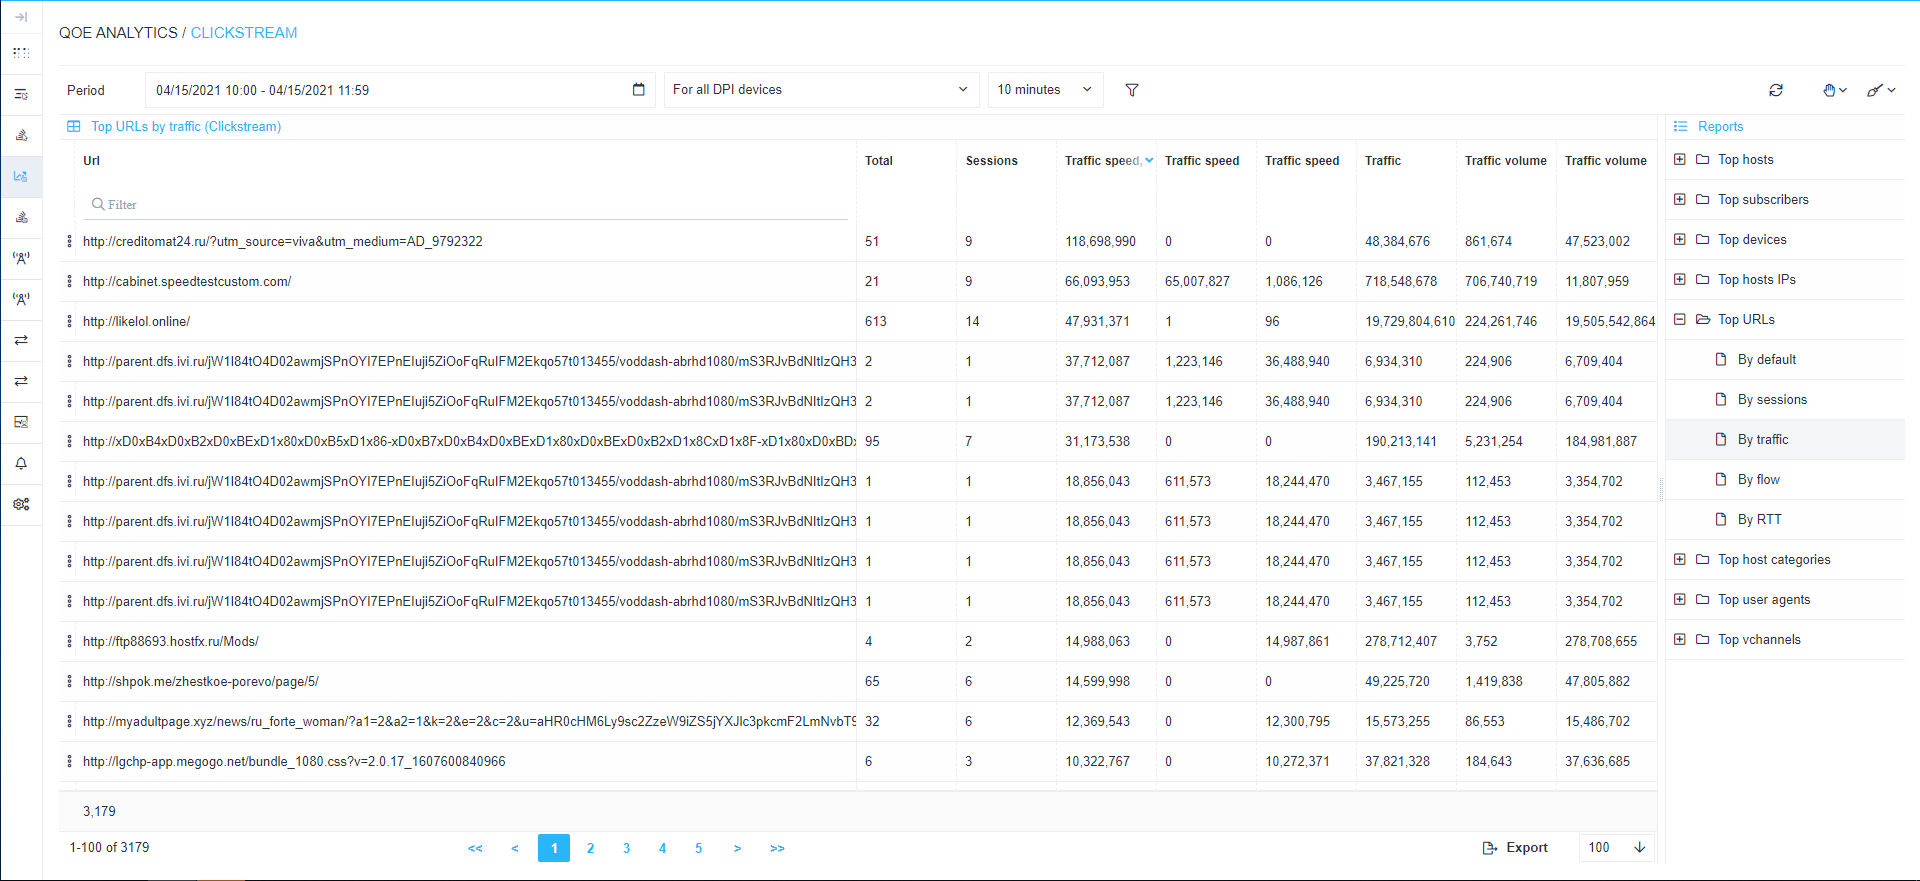
ClickStream by Traffic

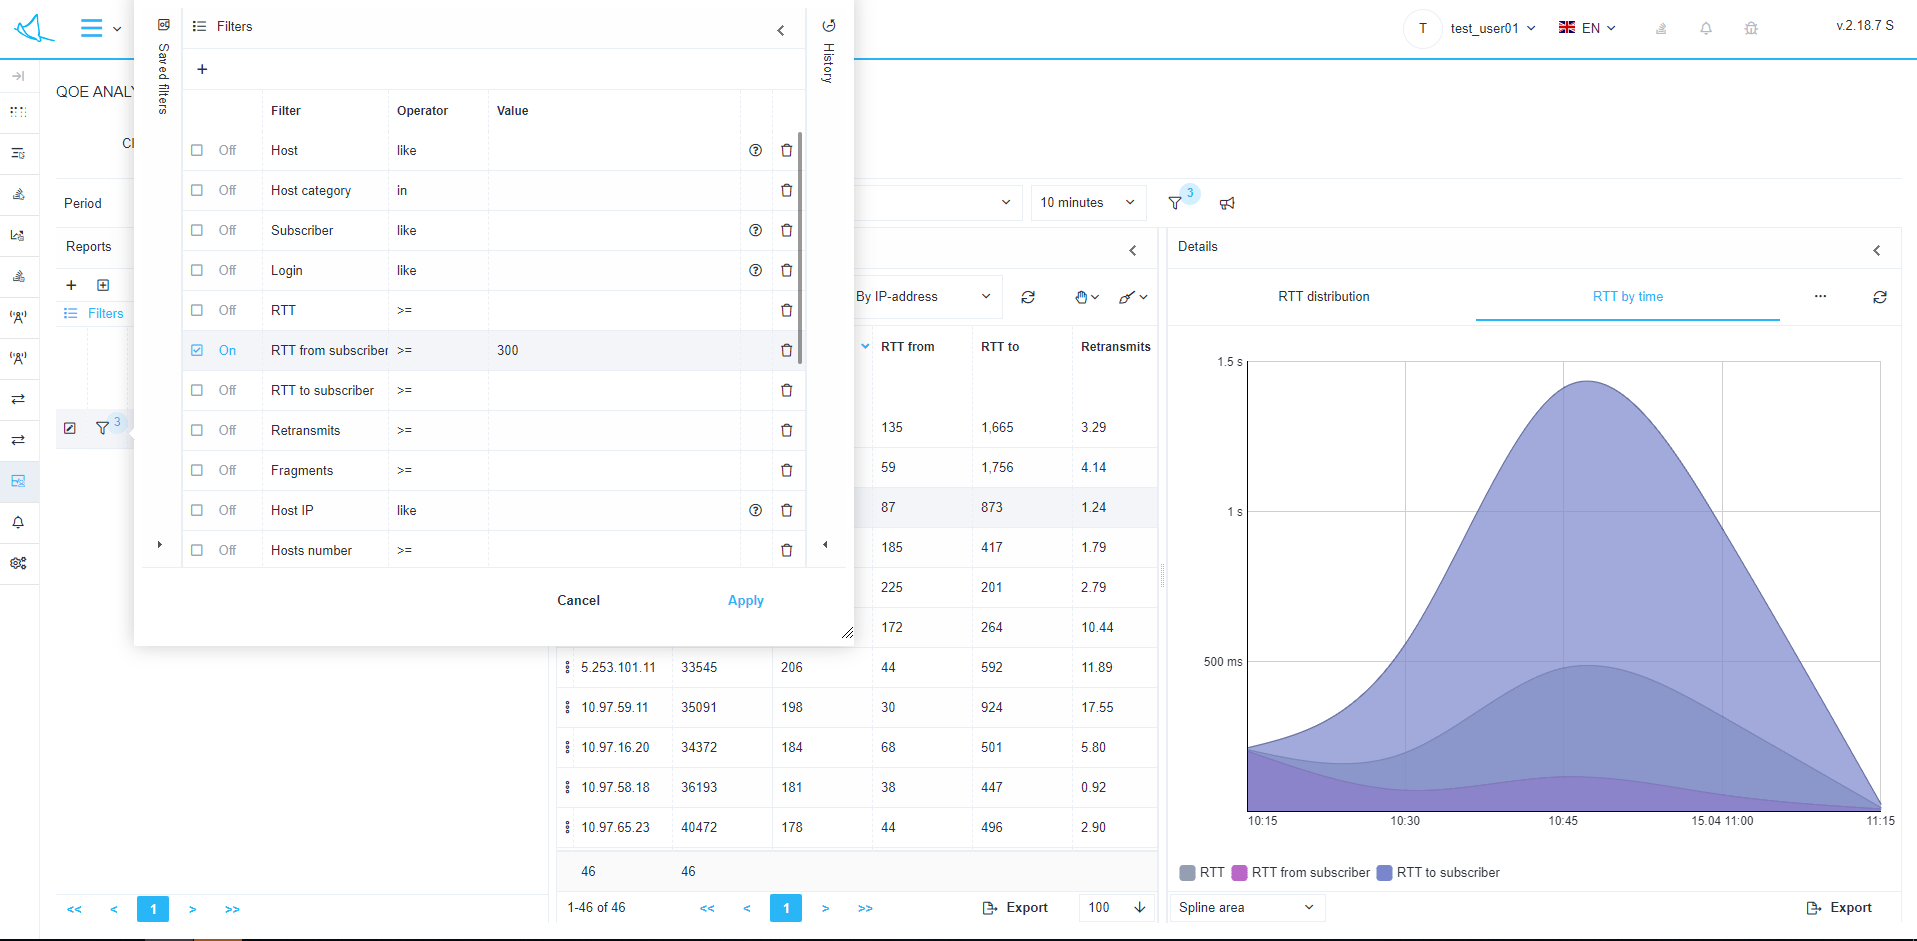
Subscribers Filtering by High RTT

Benefits:

  • increase of service quality for the customers, overall satisfaction with the services and brand strengthening
  • automatic ticket creation in support desk
  • possible combination with the other DPI features: BNG, CG-NAT, traffic filtering
  • ability to provide QoS on the operator’s network
  • enrichment with the information from billing system
  • high performance, installation on a standard x86 server
  • full-scale statistics on subscribers – which helps with tailored offers to targeted clients, resulting in efficient marketing
  • custom filters and triggers
  • easy installation and user-friendly interface
  • API for integration with other systems
  • palpable increase of the operator’s competitiveness
  • increase of a subscriber-generated revenue.

Licensing

Options
BASE
STANDARD
DPI’s Full NetFlow and ClickStream statistics visualization
Built-in reports of Full NetFlow-based TOP: high RTT, by traffic volume, by number of re-requests, by application protocols, by AS, by subscribers AS, by access switches and aggregation
Built-in ClickStream-based TOP reports: URLs, hosts, subscribers, devices, IP resources
Custom filters for built-in reports, by web resource category, by protocol group, by subscriber
Download reports in .xlsx, .csv, .pdf, .png formats
API support for integration with external systems
Monitoring of aplink quality and cyber threats
Online reports by specific IP, Login
NAT Flow statistics collection, compression, custom filters
GTP Flow statistics collection, compression, custom filters, map visualization
Setting triggers and actions on events, DDoS and BotNet detection
Sending preconfigured reports to email and telegram with specified frequency
Special reports
Yes
Optional

Request a demo

Fill in the form
We will contact you, specify the task, provide access to the documentation and answer your questions.
Choose the solution
We discuss the current situation: traffic volume, available equipment, the functionality you need.
Free trial
Our engeniers install the selected software and adapt it to your specific tasks. Сontract — only after the test is successful.
We use cookies to optimize site functionality and give you the best possible experience. To learn more about the cookies we use, please visit our Cookies Policy. By clicking ‘Okay’, you agree to our use of cookies. Learn more.