
At the same time, the volume of configurations, logs, and alarm events grows, and the connections between components become more complex. As a result, engineers spend more time collecting data from different interfaces and nodes than on the diagnostics itself.
As a result, the need arises for a unified management system that brings together work with network elements, configurations, alarms, and operational statistics.
What is Stingray NMS
Stingray NMS is the management system for the Stingray platform. It combines configuration, monitoring, statistics collection, alarm processing, and action auditing across all VAS Experts products.
Stingray NMS is delivered as a virtualized solution and integrates into the operator’s existing infrastructure without being tied to a specific hardware platform.
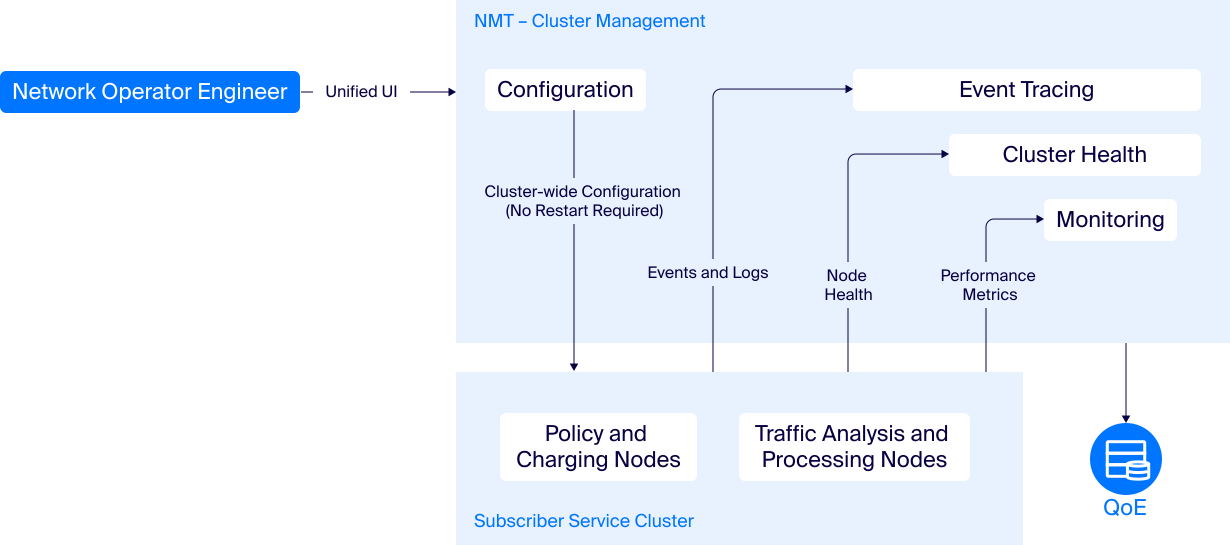
Stingray NMS architecture
Deployment and infrastructure
The system is deployed in the customer’s virtualization cluster, in a dedicated TelcoCloud infrastructure, or on separate servers allocated for network functions. VMware and OpenStack environments are supported.
For operator installations, VAS Experts uses the vStack HCP virtualization platform, on which DPI, CG-NAT, BNG, the QoE analytics module, and management services are deployed. The platform allows network functions to run in a single virtualized environment and simplifies the scaling of operator services under the TelcoCloud model.
ITPOD servers are used as the recommended hardware platform. The company’s solutions are designed to host high-load network services and have been tested for compatibility with the vStack HCP virtualization platform.
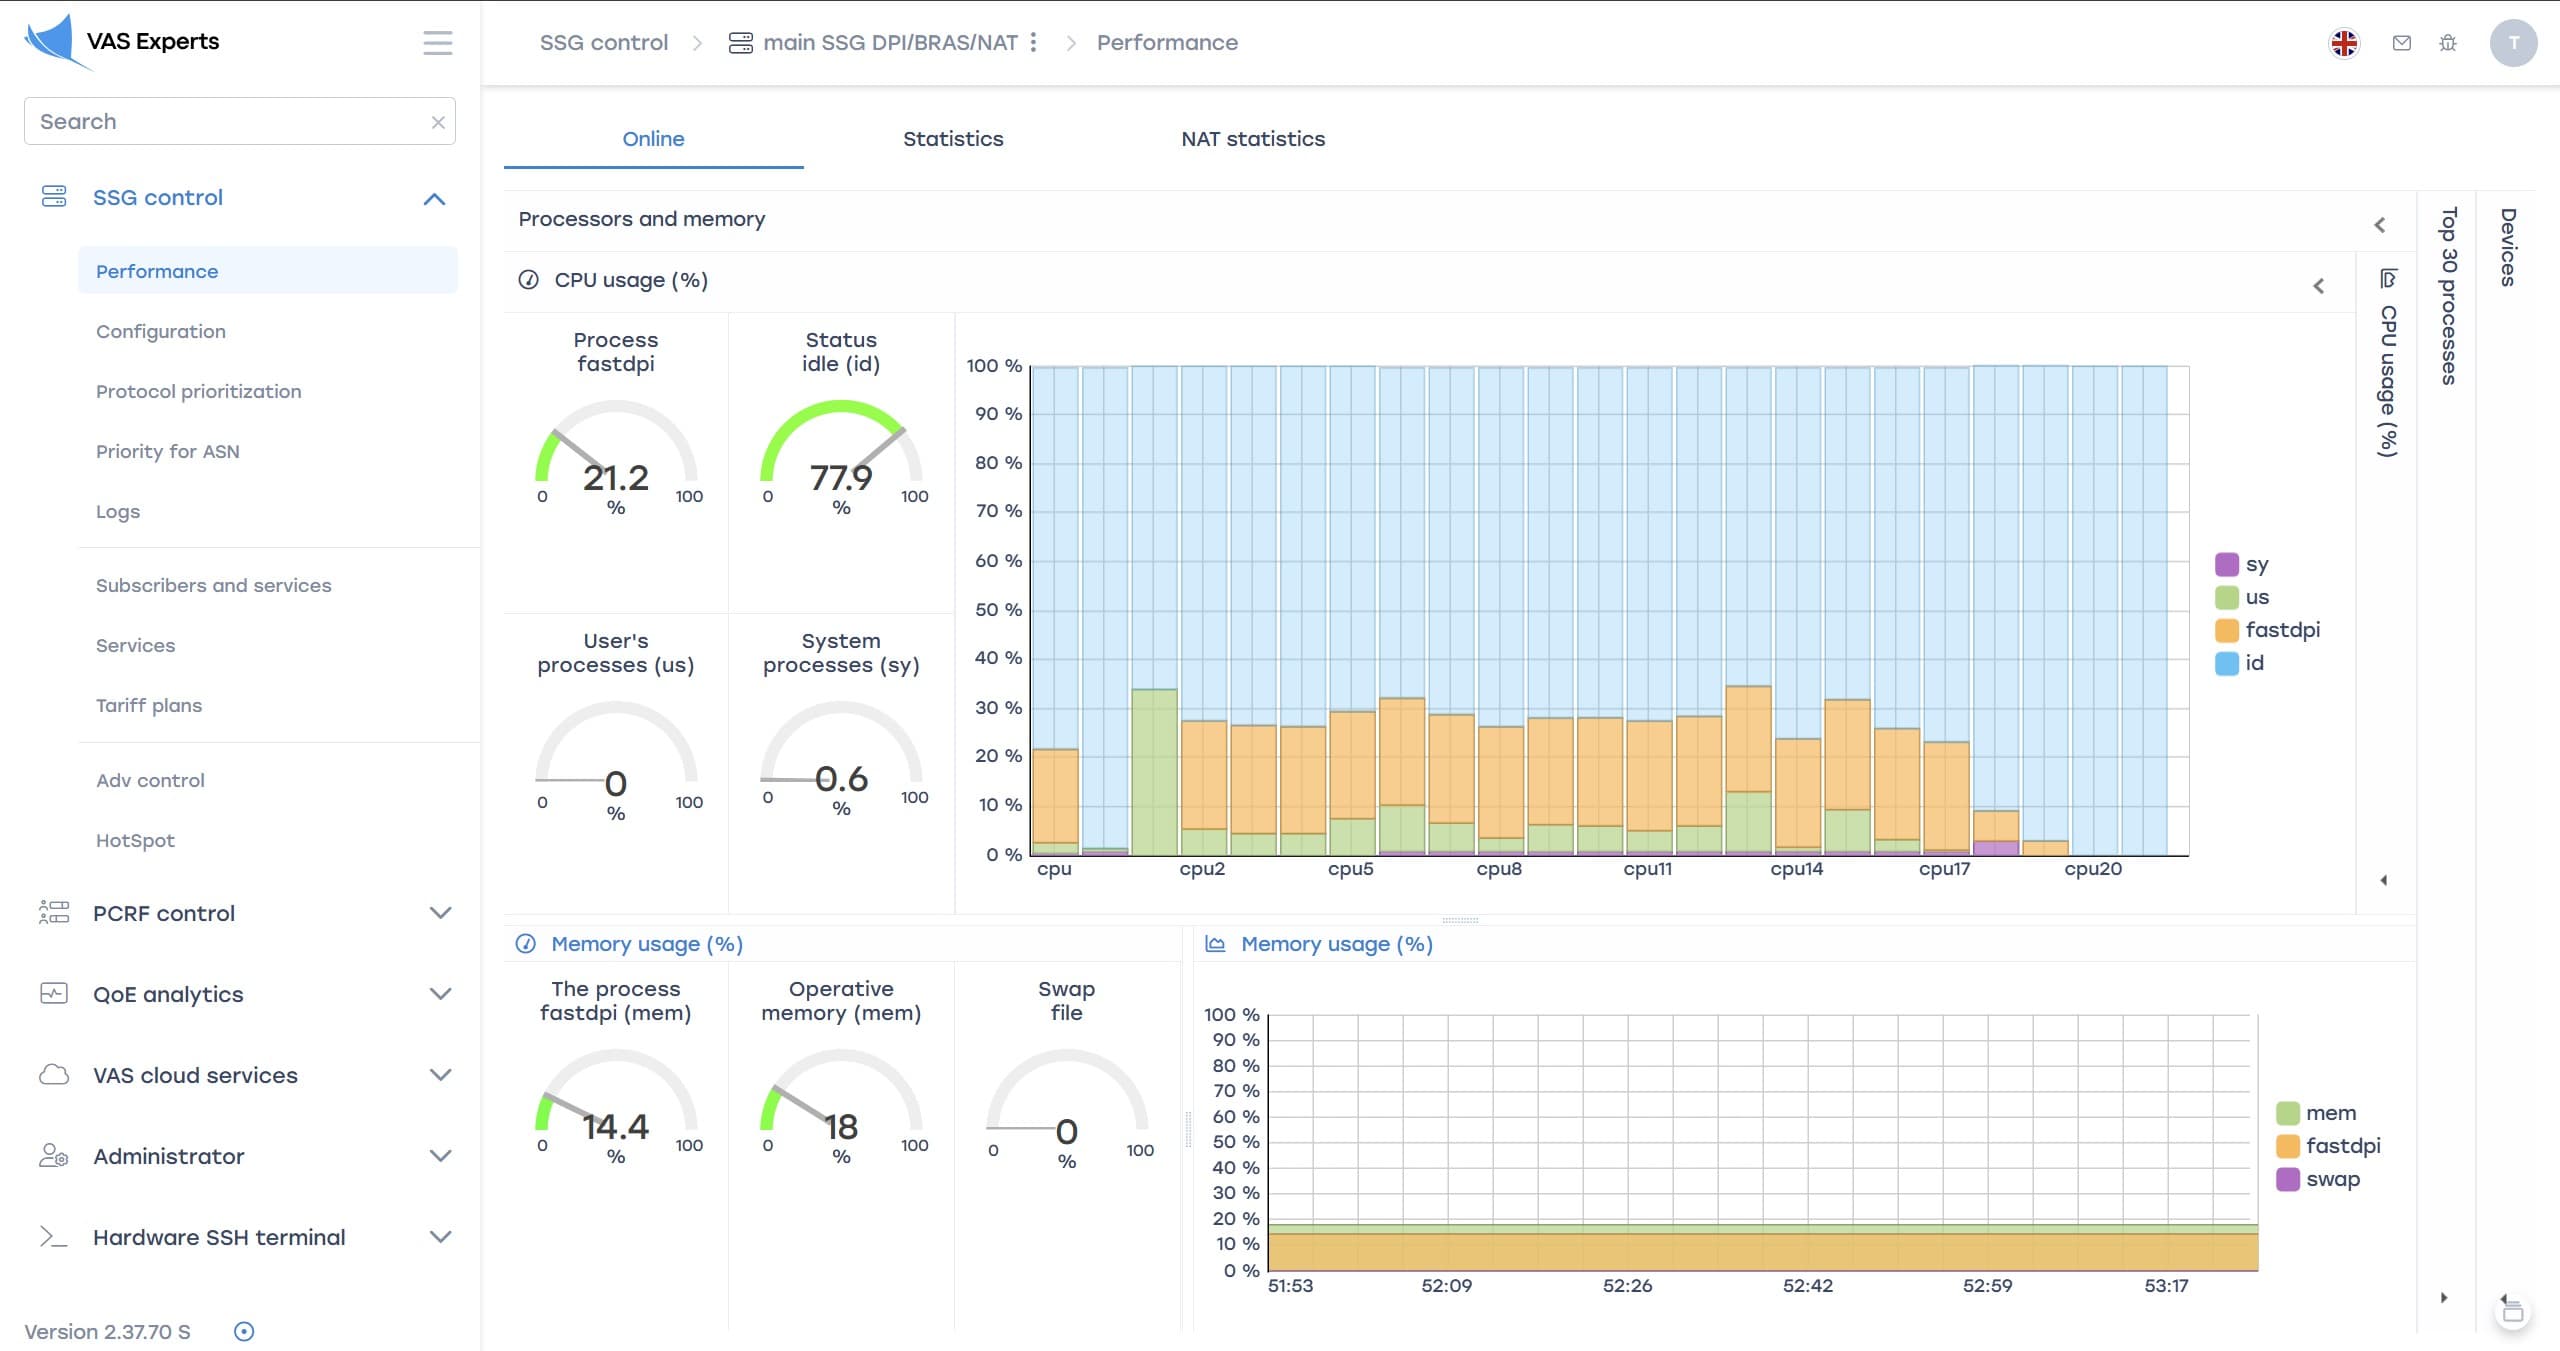
Performance monitoring interface
In a fault-tolerant configuration, NMS, DPI, CG-NAT, BNG, and QoE components are distributed across several virtualization nodes. If one hypervisor becomes unavailable, the remaining components continue running on the neighboring nodes of the cluster.
In large-scale installations, QoE databases and analytics services are moved to separate nodes — this is critical for large volumes of user traffic and long statistics retention periods.
Backup covers not only the system layer but also operational data — configurations, QoE databases, licenses, event logs, and service parameters. Backups can be run manually via the Web GUI or CLI, as well as automatically on a schedule.
Backup files can be stored locally or uploaded to external storage systems via SFTP. This makes it possible to embed the NMS into existing disaster recovery and data storage processes.
Configuration management
Management of DPI, BNG, CG-NAT, and other platform component parameters is performed centrally in the NMS. Configurations can be changed via the Web GUI, CLI, or API.
Depending on the equipment type, REST API, SNMP, SSH, HTTP(S), or Netconf are used.
The interface displays the node’s current configuration, change history, and the author of each edit.
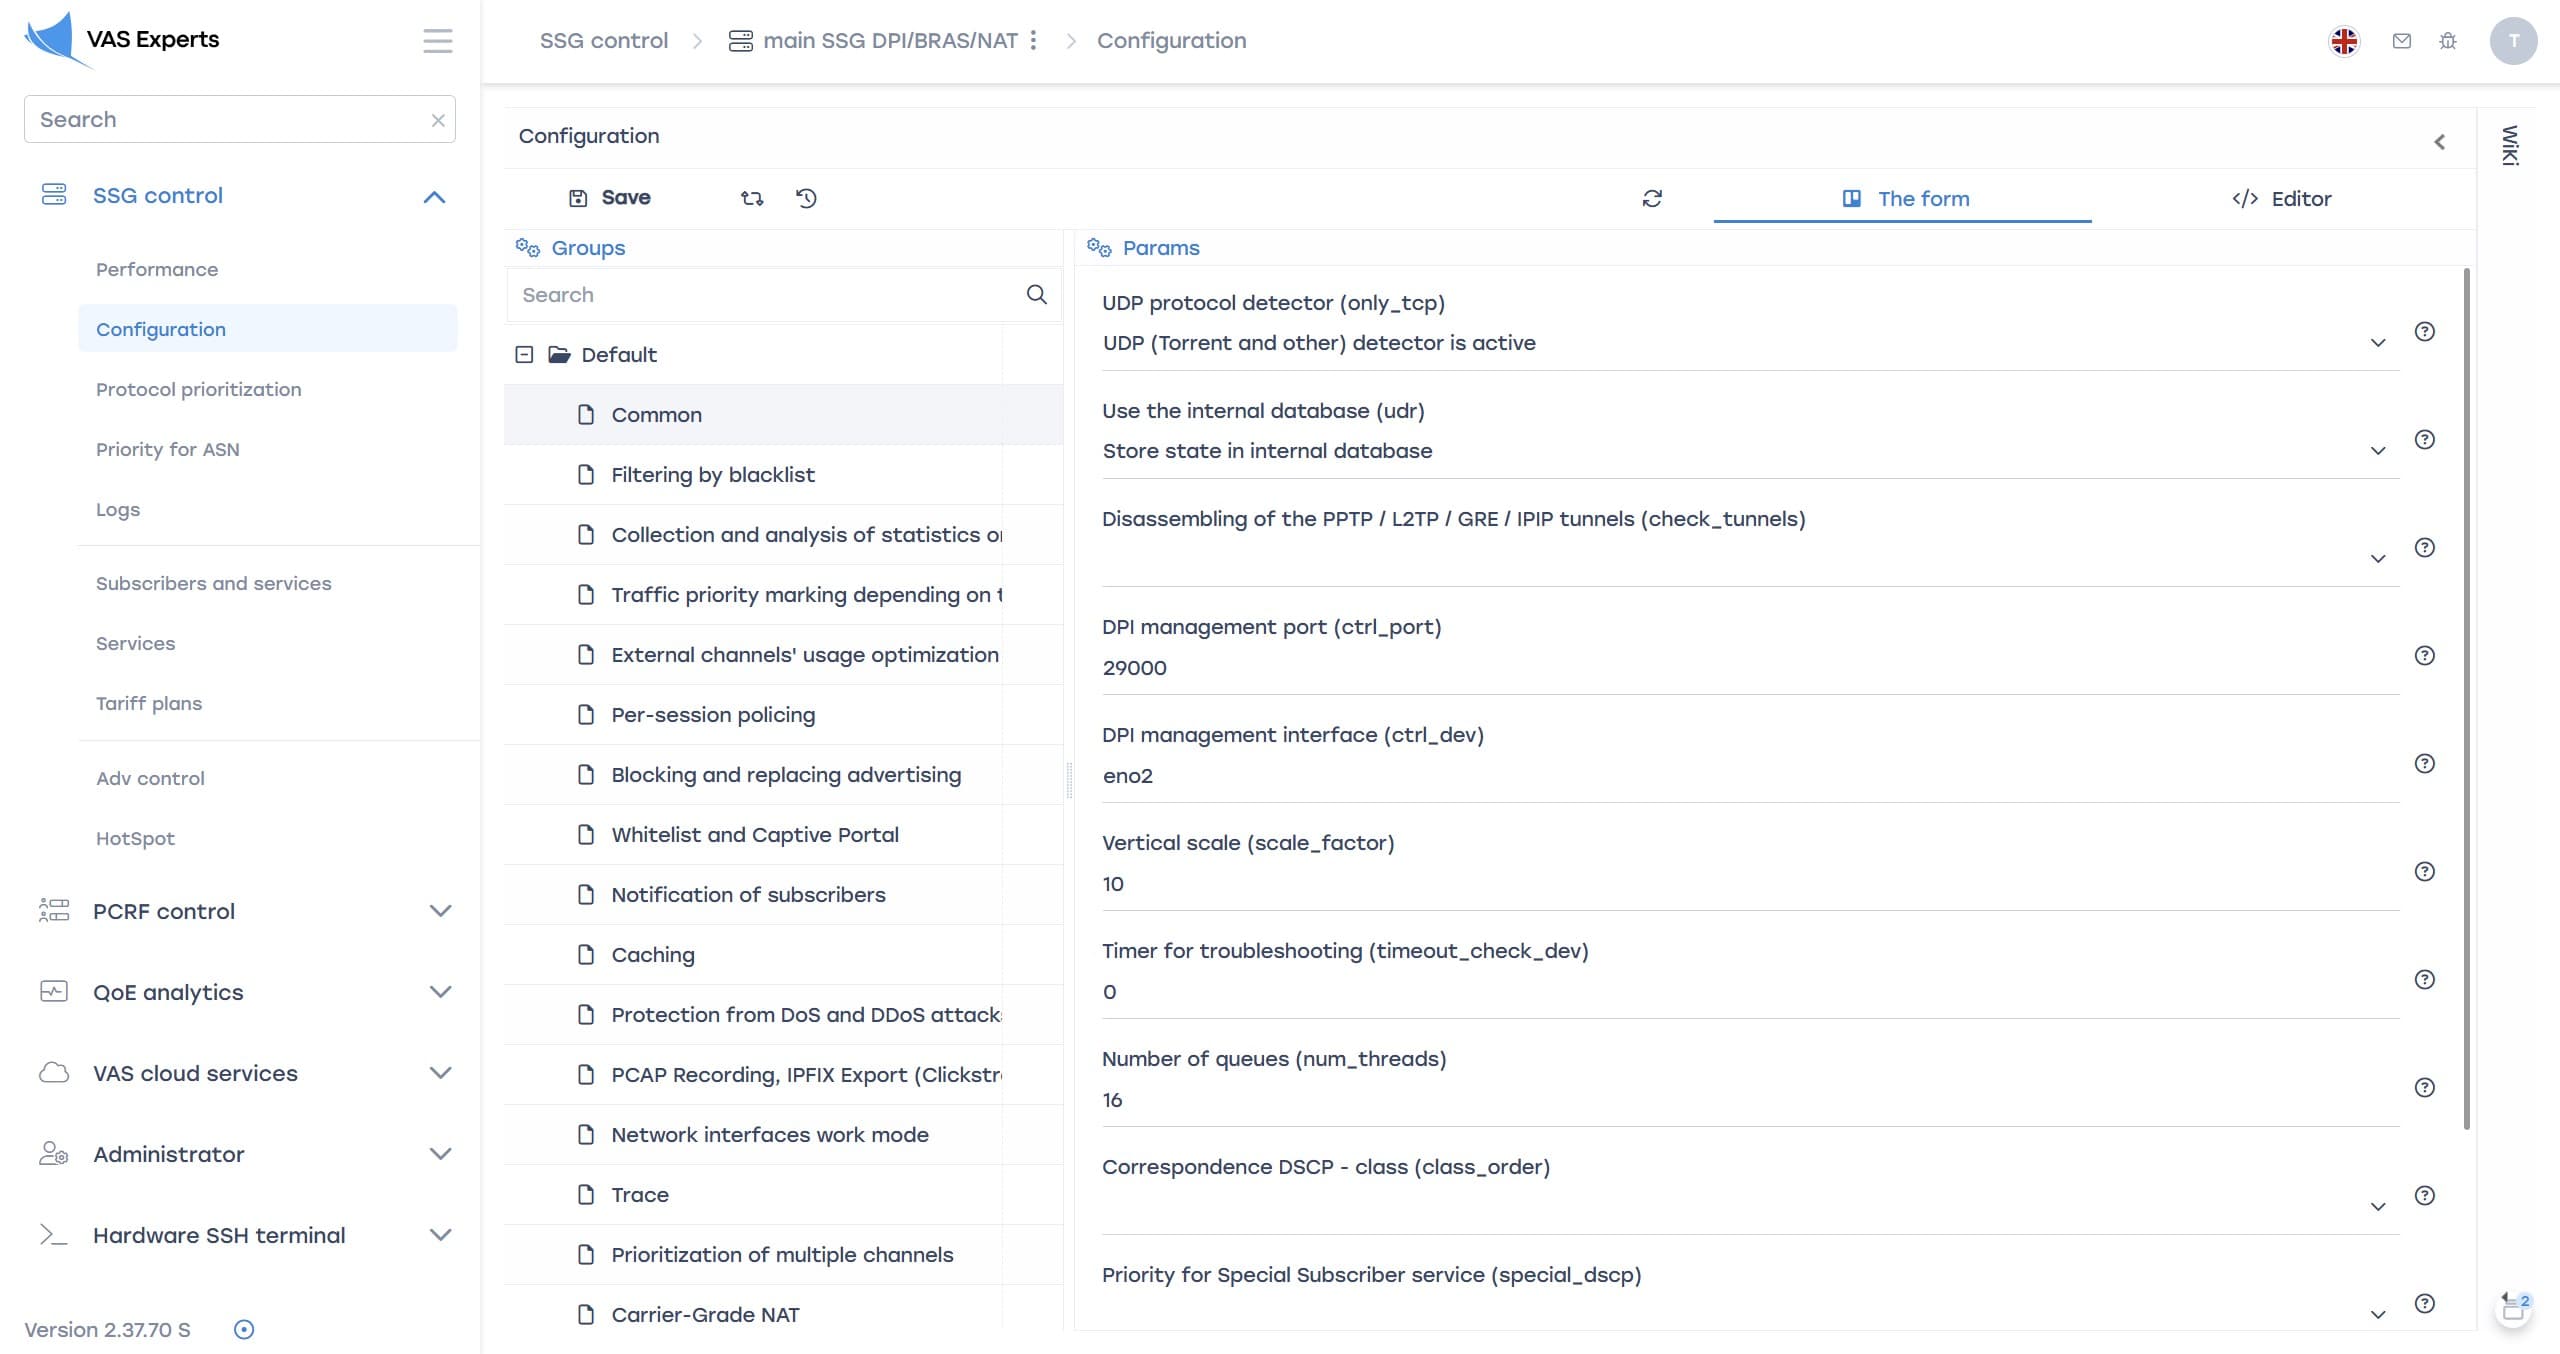
The «Configuration» section in the «DPI Management» module
Comparison of any two configuration versions (diff) with highlighted changes is available.
If the connection to a network element is lost, the NMS records the state discrepancy and puts the object into desynchronization mode. Once the connection is restored, the NMS automatically synchronizes the configurations and returns the node to its up-to-date state.
The mechanism is useful during upgrades, migrations, and service switchovers between sites.
Regular configuration comparison detects manual changes made outside the management system. Once the connection is restored, the system can automatically bring the node’s configuration back to the reference state.
Monitoring and QoE metrics
QoE within Stingray collects statistics on user connections and transmits the data to the analytics system. The data includes traffic parameters, interface load, and subscriber quality-of-service indicators.
The NMS uses this data for dashboards, KPIs, and reporting. Through the interface, you can view:
- traffic distribution by application;
- RTT (Round-Trip Time) and the share of retransmissions;
- number of user sessions;
- service load;
- statistics by network segment.
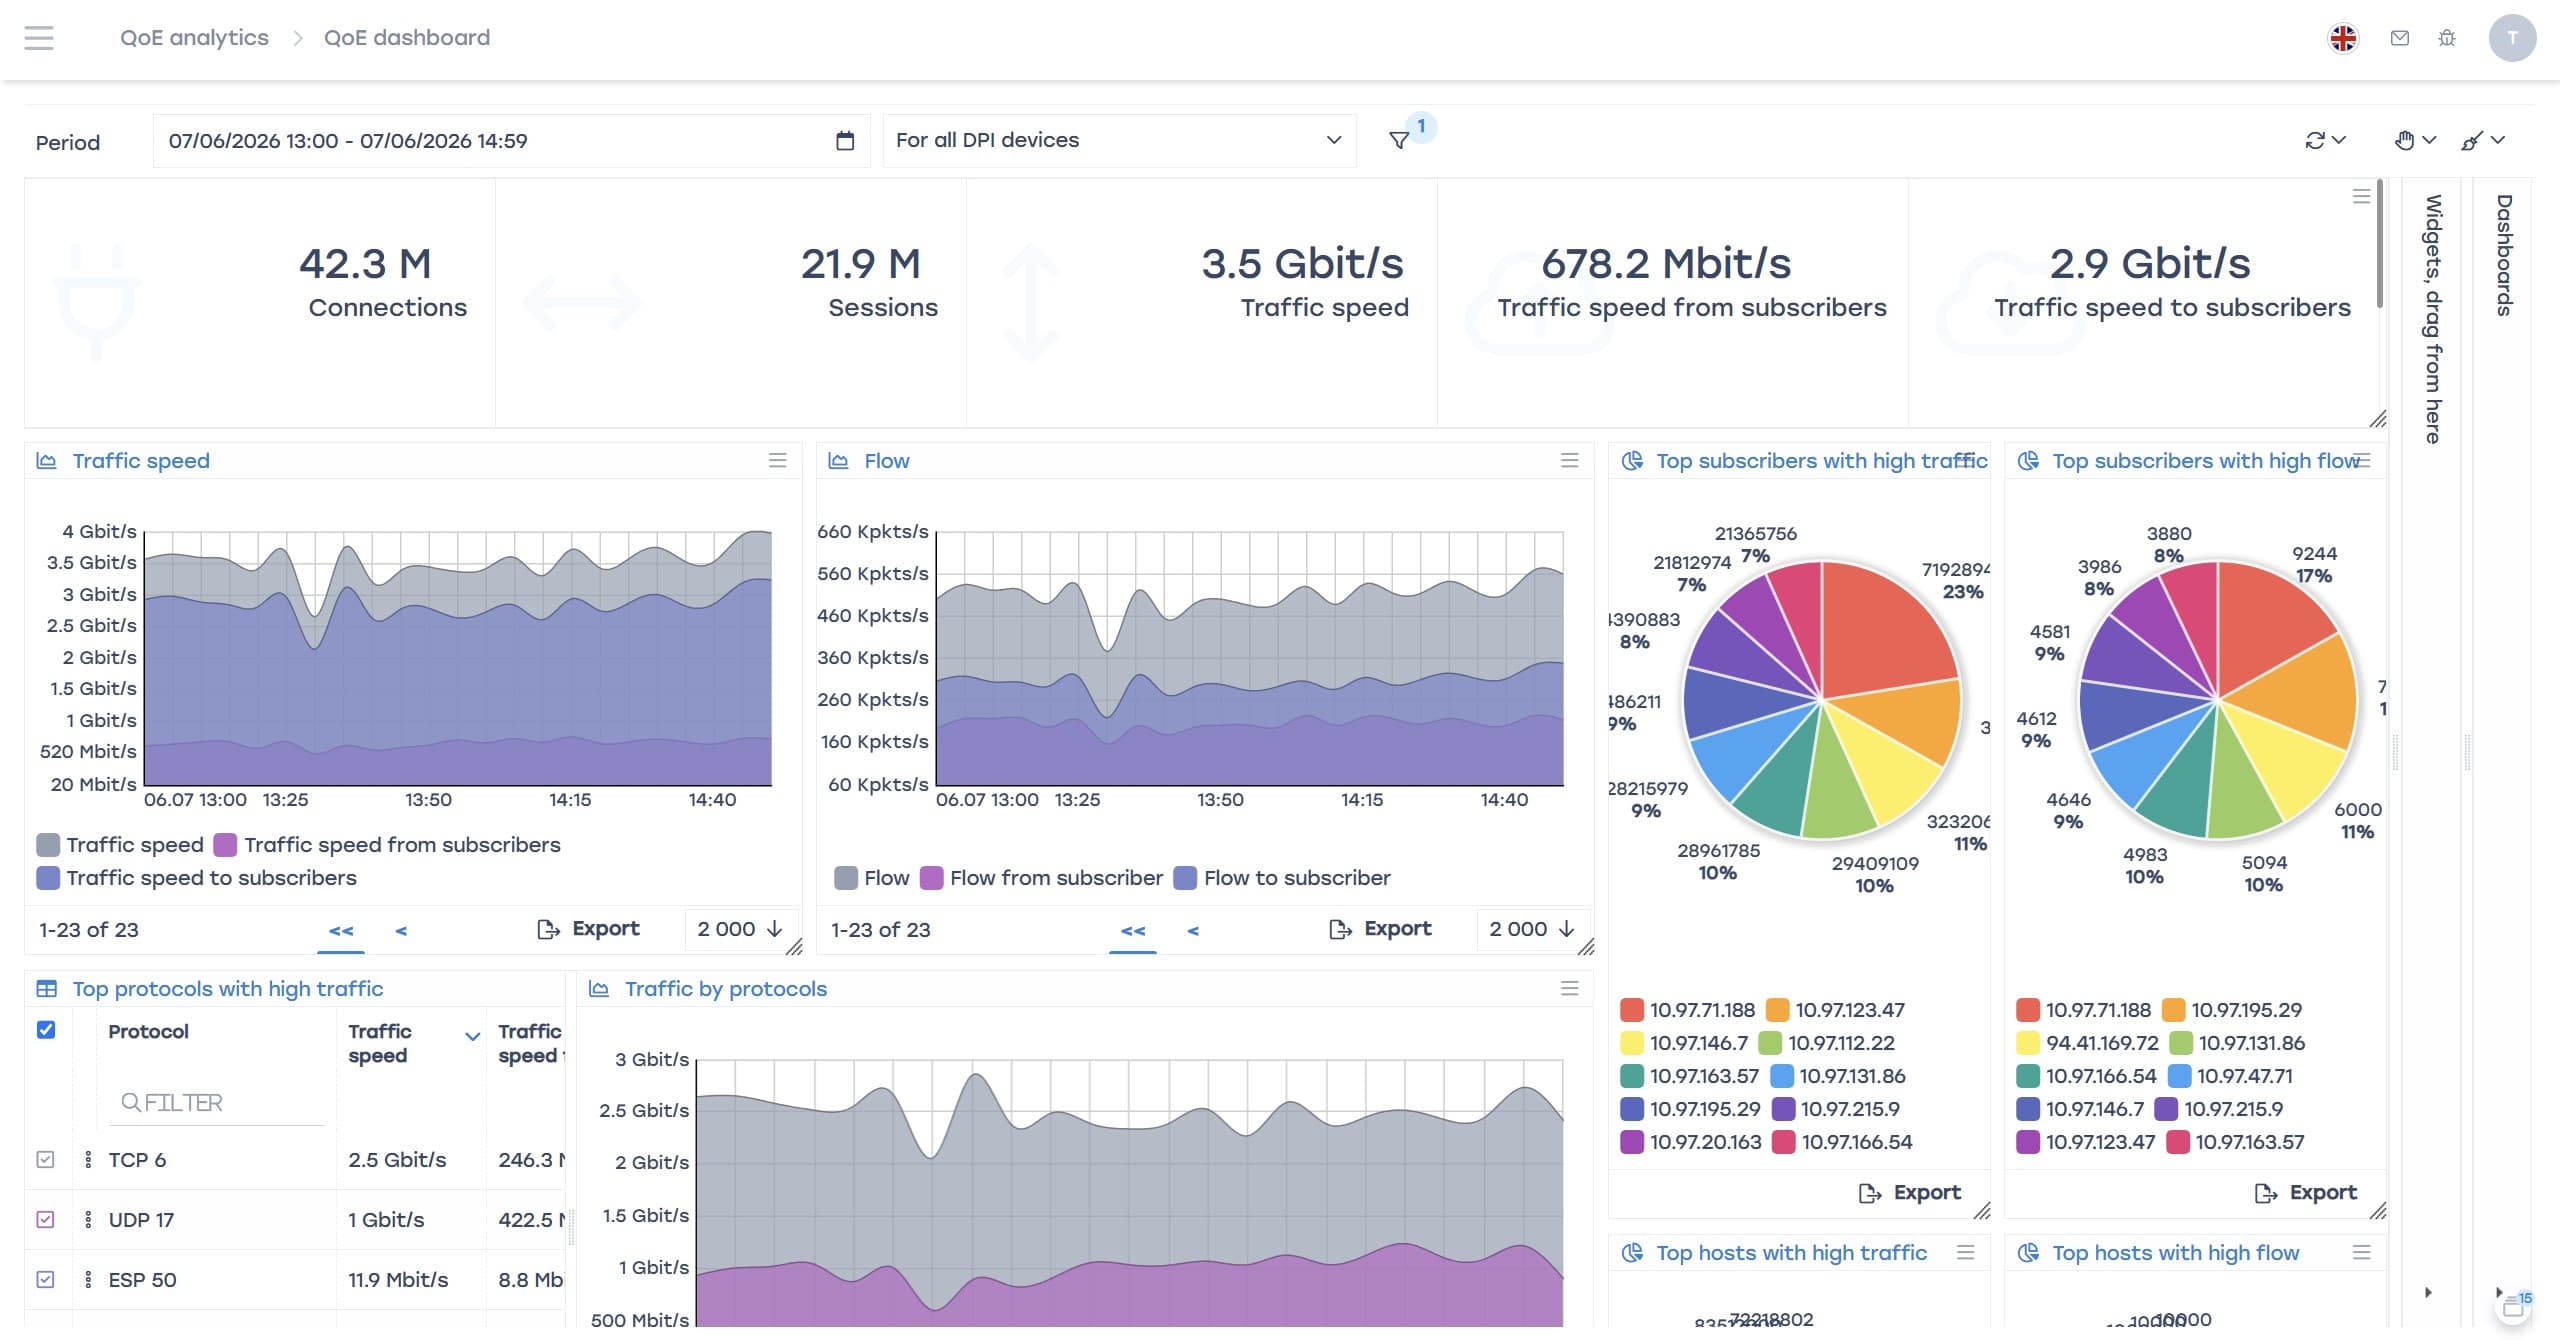
QoE analytics dashboard with traffic, session, and subscriber indicators
Logging and event auditing
The system centrally collects events from both NMS components and managed network elements. The log includes:
- user actions;
- configuration changes;
- system events;
- service operations;
- security events.
Logs are centralized within the NMS and can be searched by time, event type, or specific node. The minimum log retention period is one month, and the actual period is configured by operational policy.
Syslog, SNMP traps, and REST API are supported. Alarms and events can be processed both within the NMS and within the operator’s existing environment.
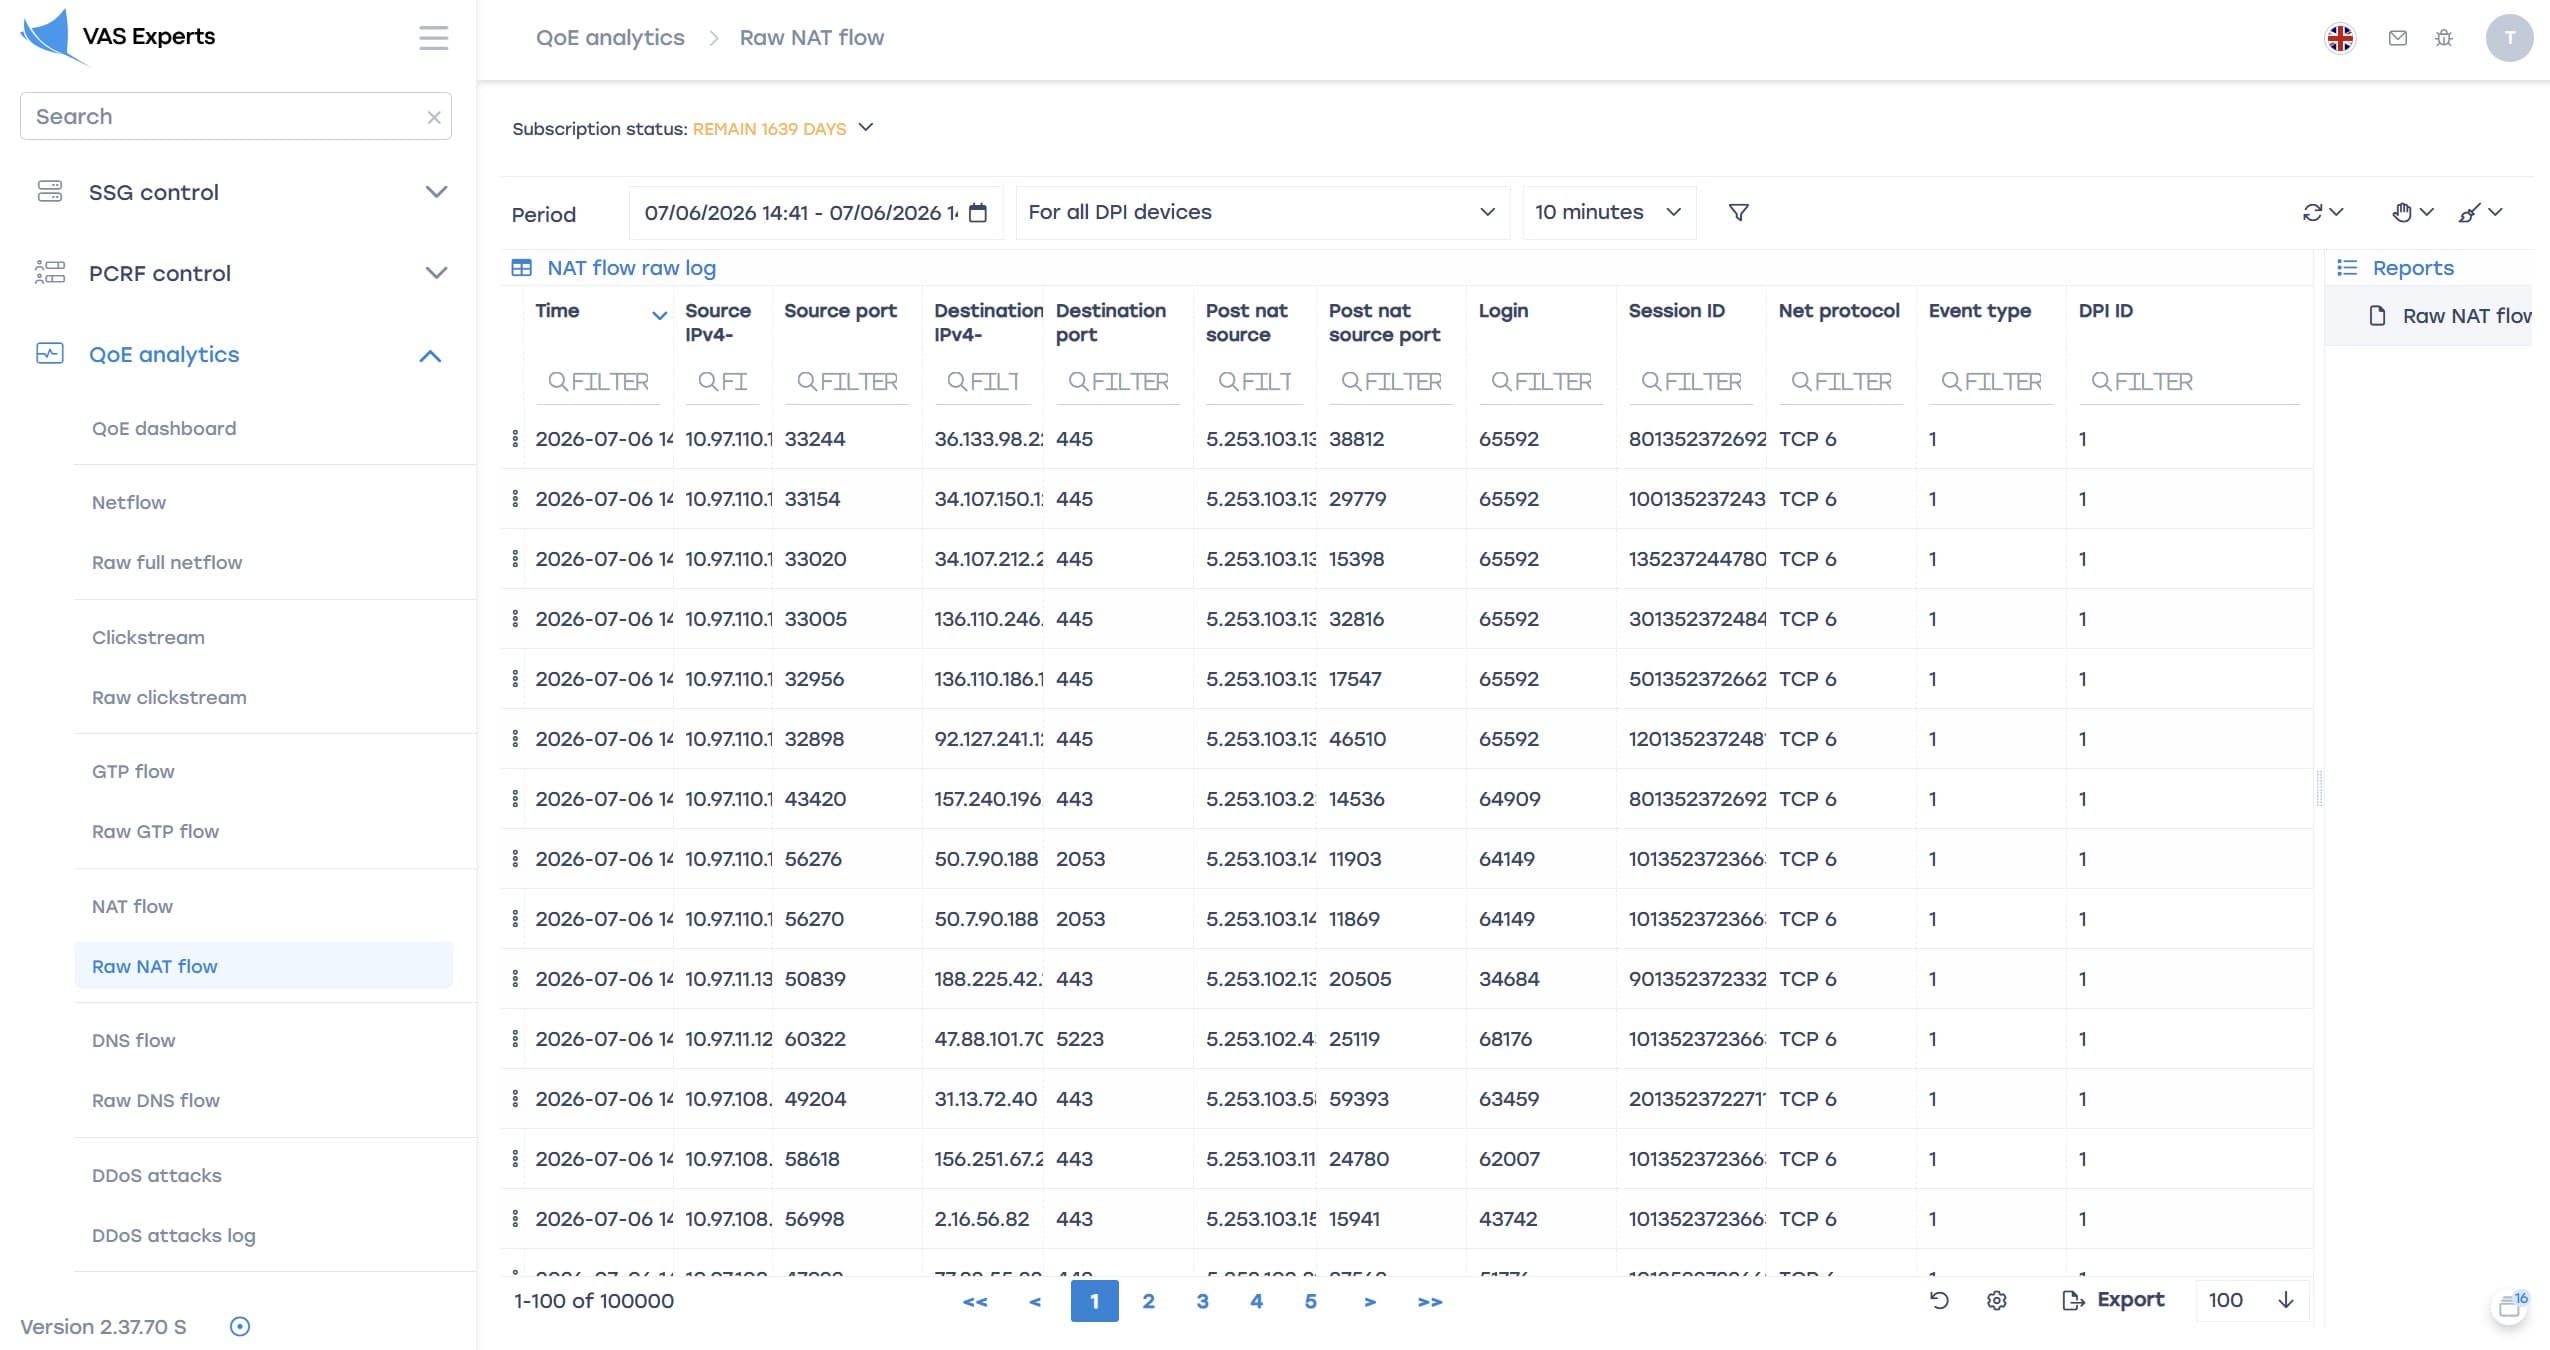
NAT event log in QoE analytics
Reporting
Reports are built directly from the QoE database. You can select the time range, specific nodes, network segments, or individual applications.
Report generation is launched manually or on a schedule. Completed reports are saved in the personal account and can be exported to external systems.
Sending by email and export via the web interface are supported. This makes it possible to integrate reporting into existing operational processes without manual data generation.
Security and operations
Secure protocols HTTPS, SSH, and SFTP are used to access the system.
The NMS supports a role-based access model (RBAC). Permissions are divided among the NOC, operations team, information security, and external contractors. For example, one group of users only gets access to monitoring and alarms, while another can change DPI and BNG configurations.
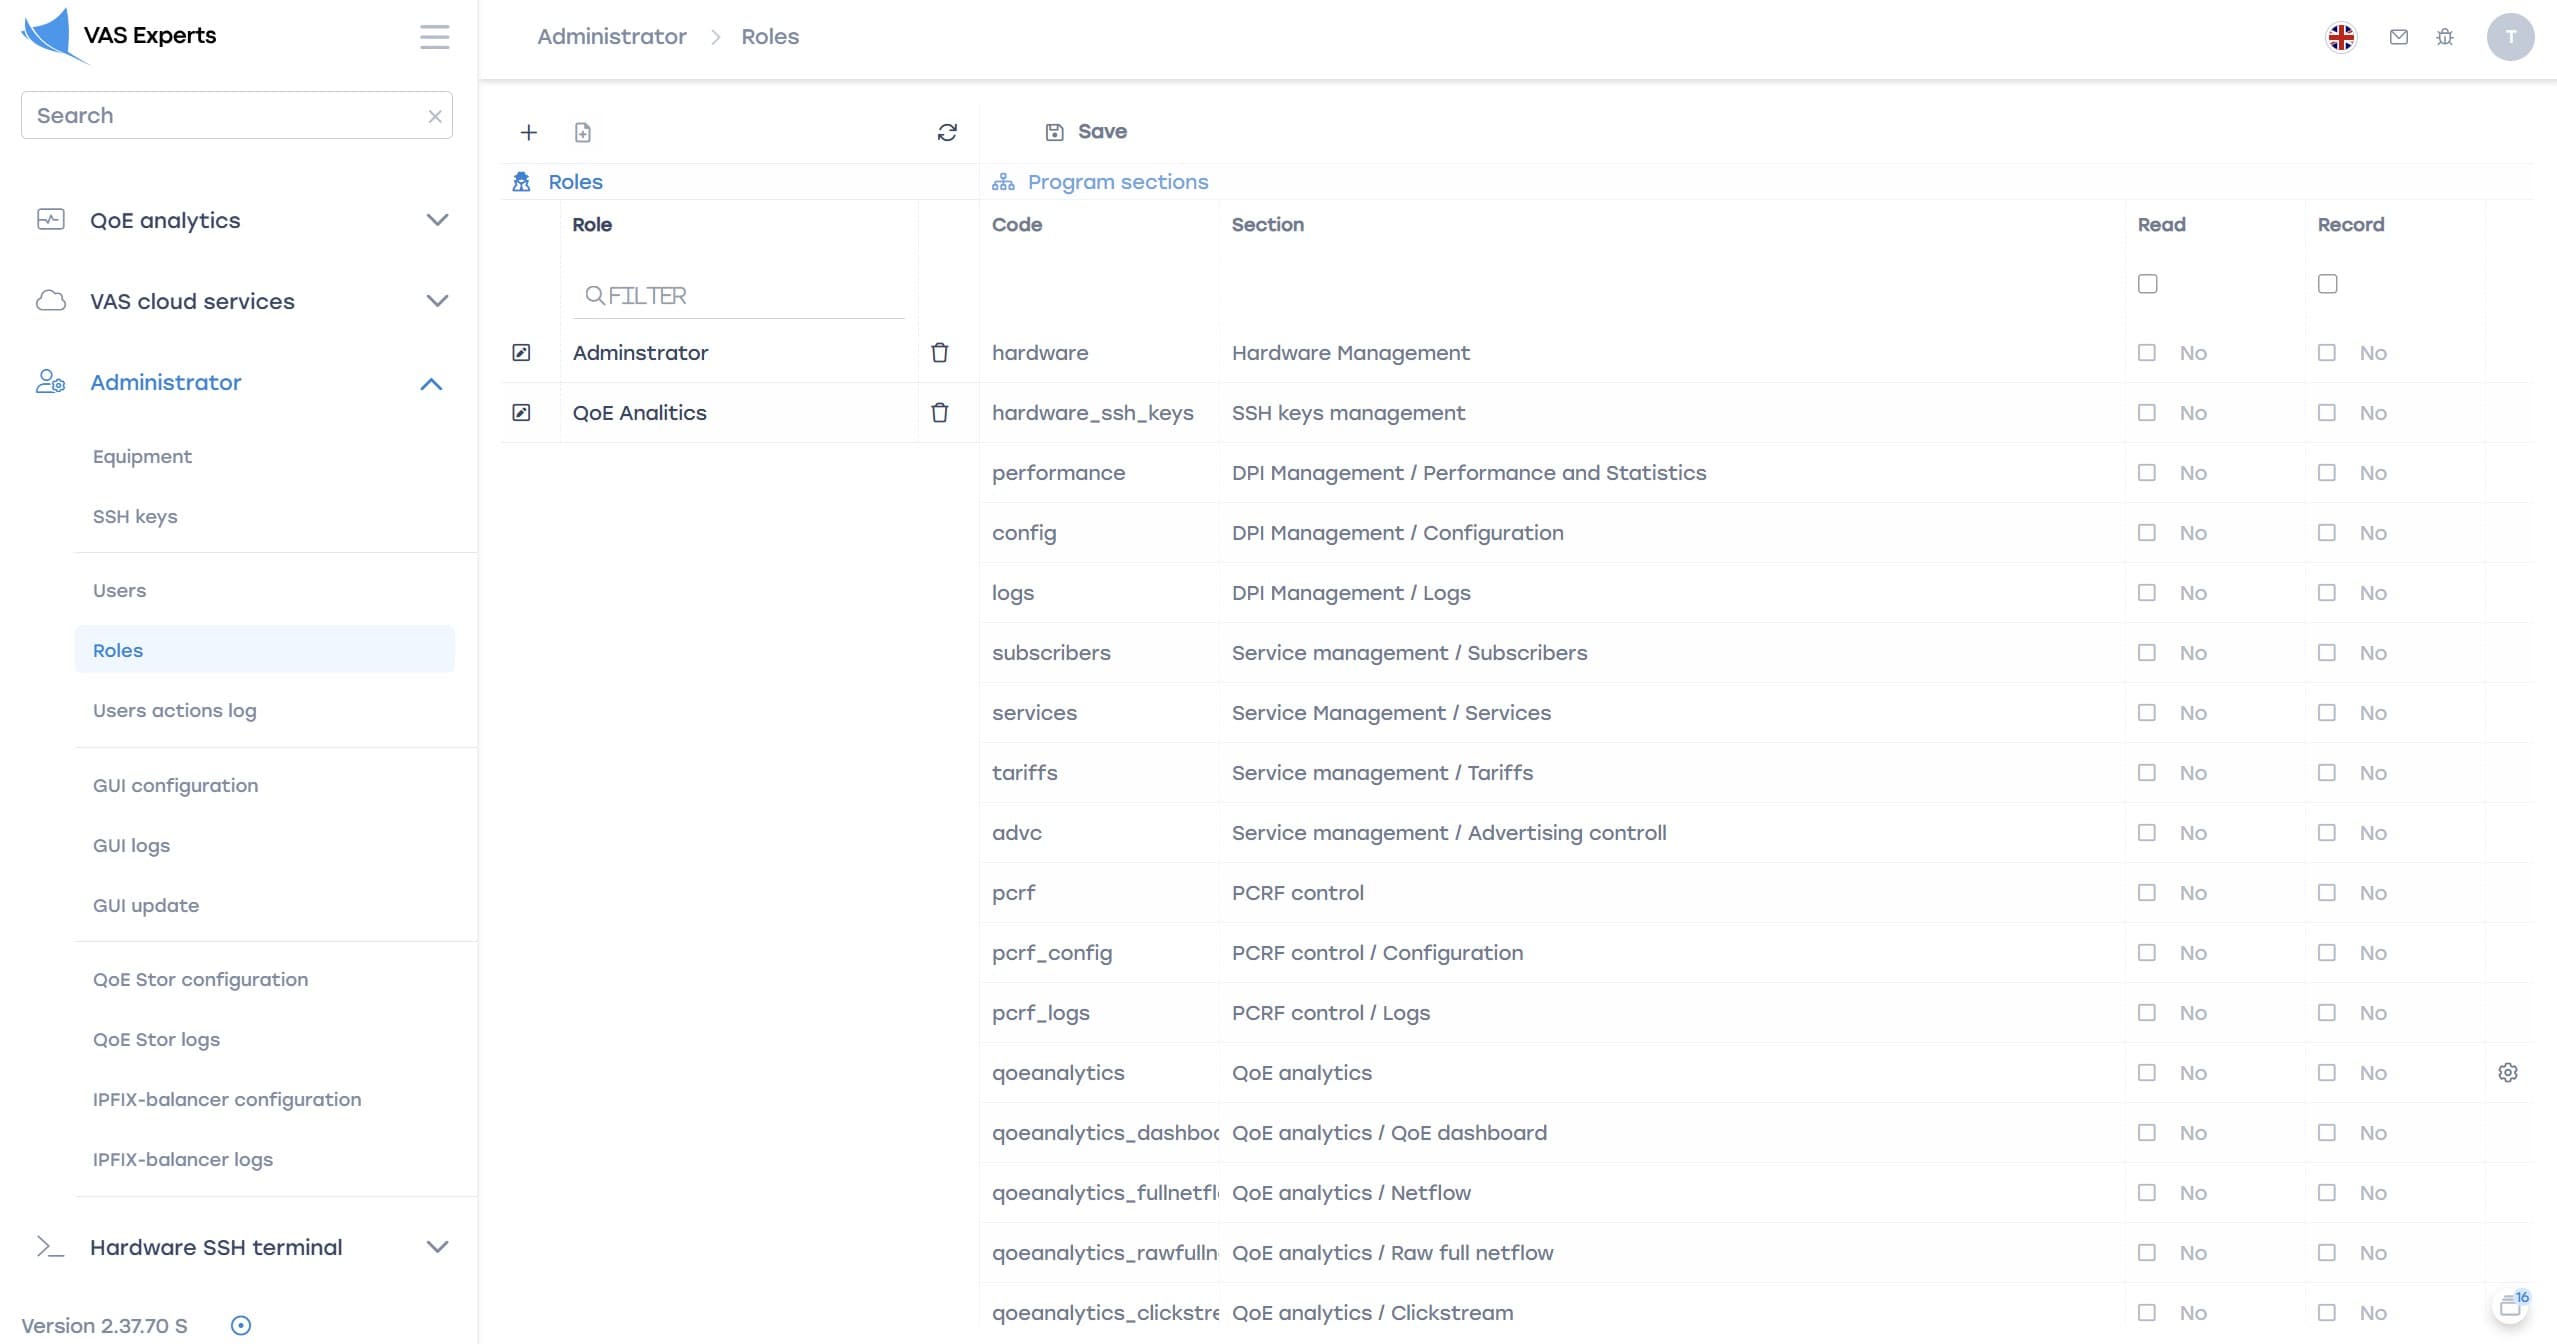
Configuring roles and access rights in the «Administrator» section
Authentication is performed via LDAP, Active Directory, RADIUS, or SSO. The system limits concurrent connections under the same user. All user actions are recorded in the audit log.
It records:
- configuration changes;
- diagnostics launches;
- service operations;
- login attempts;
- API activity.
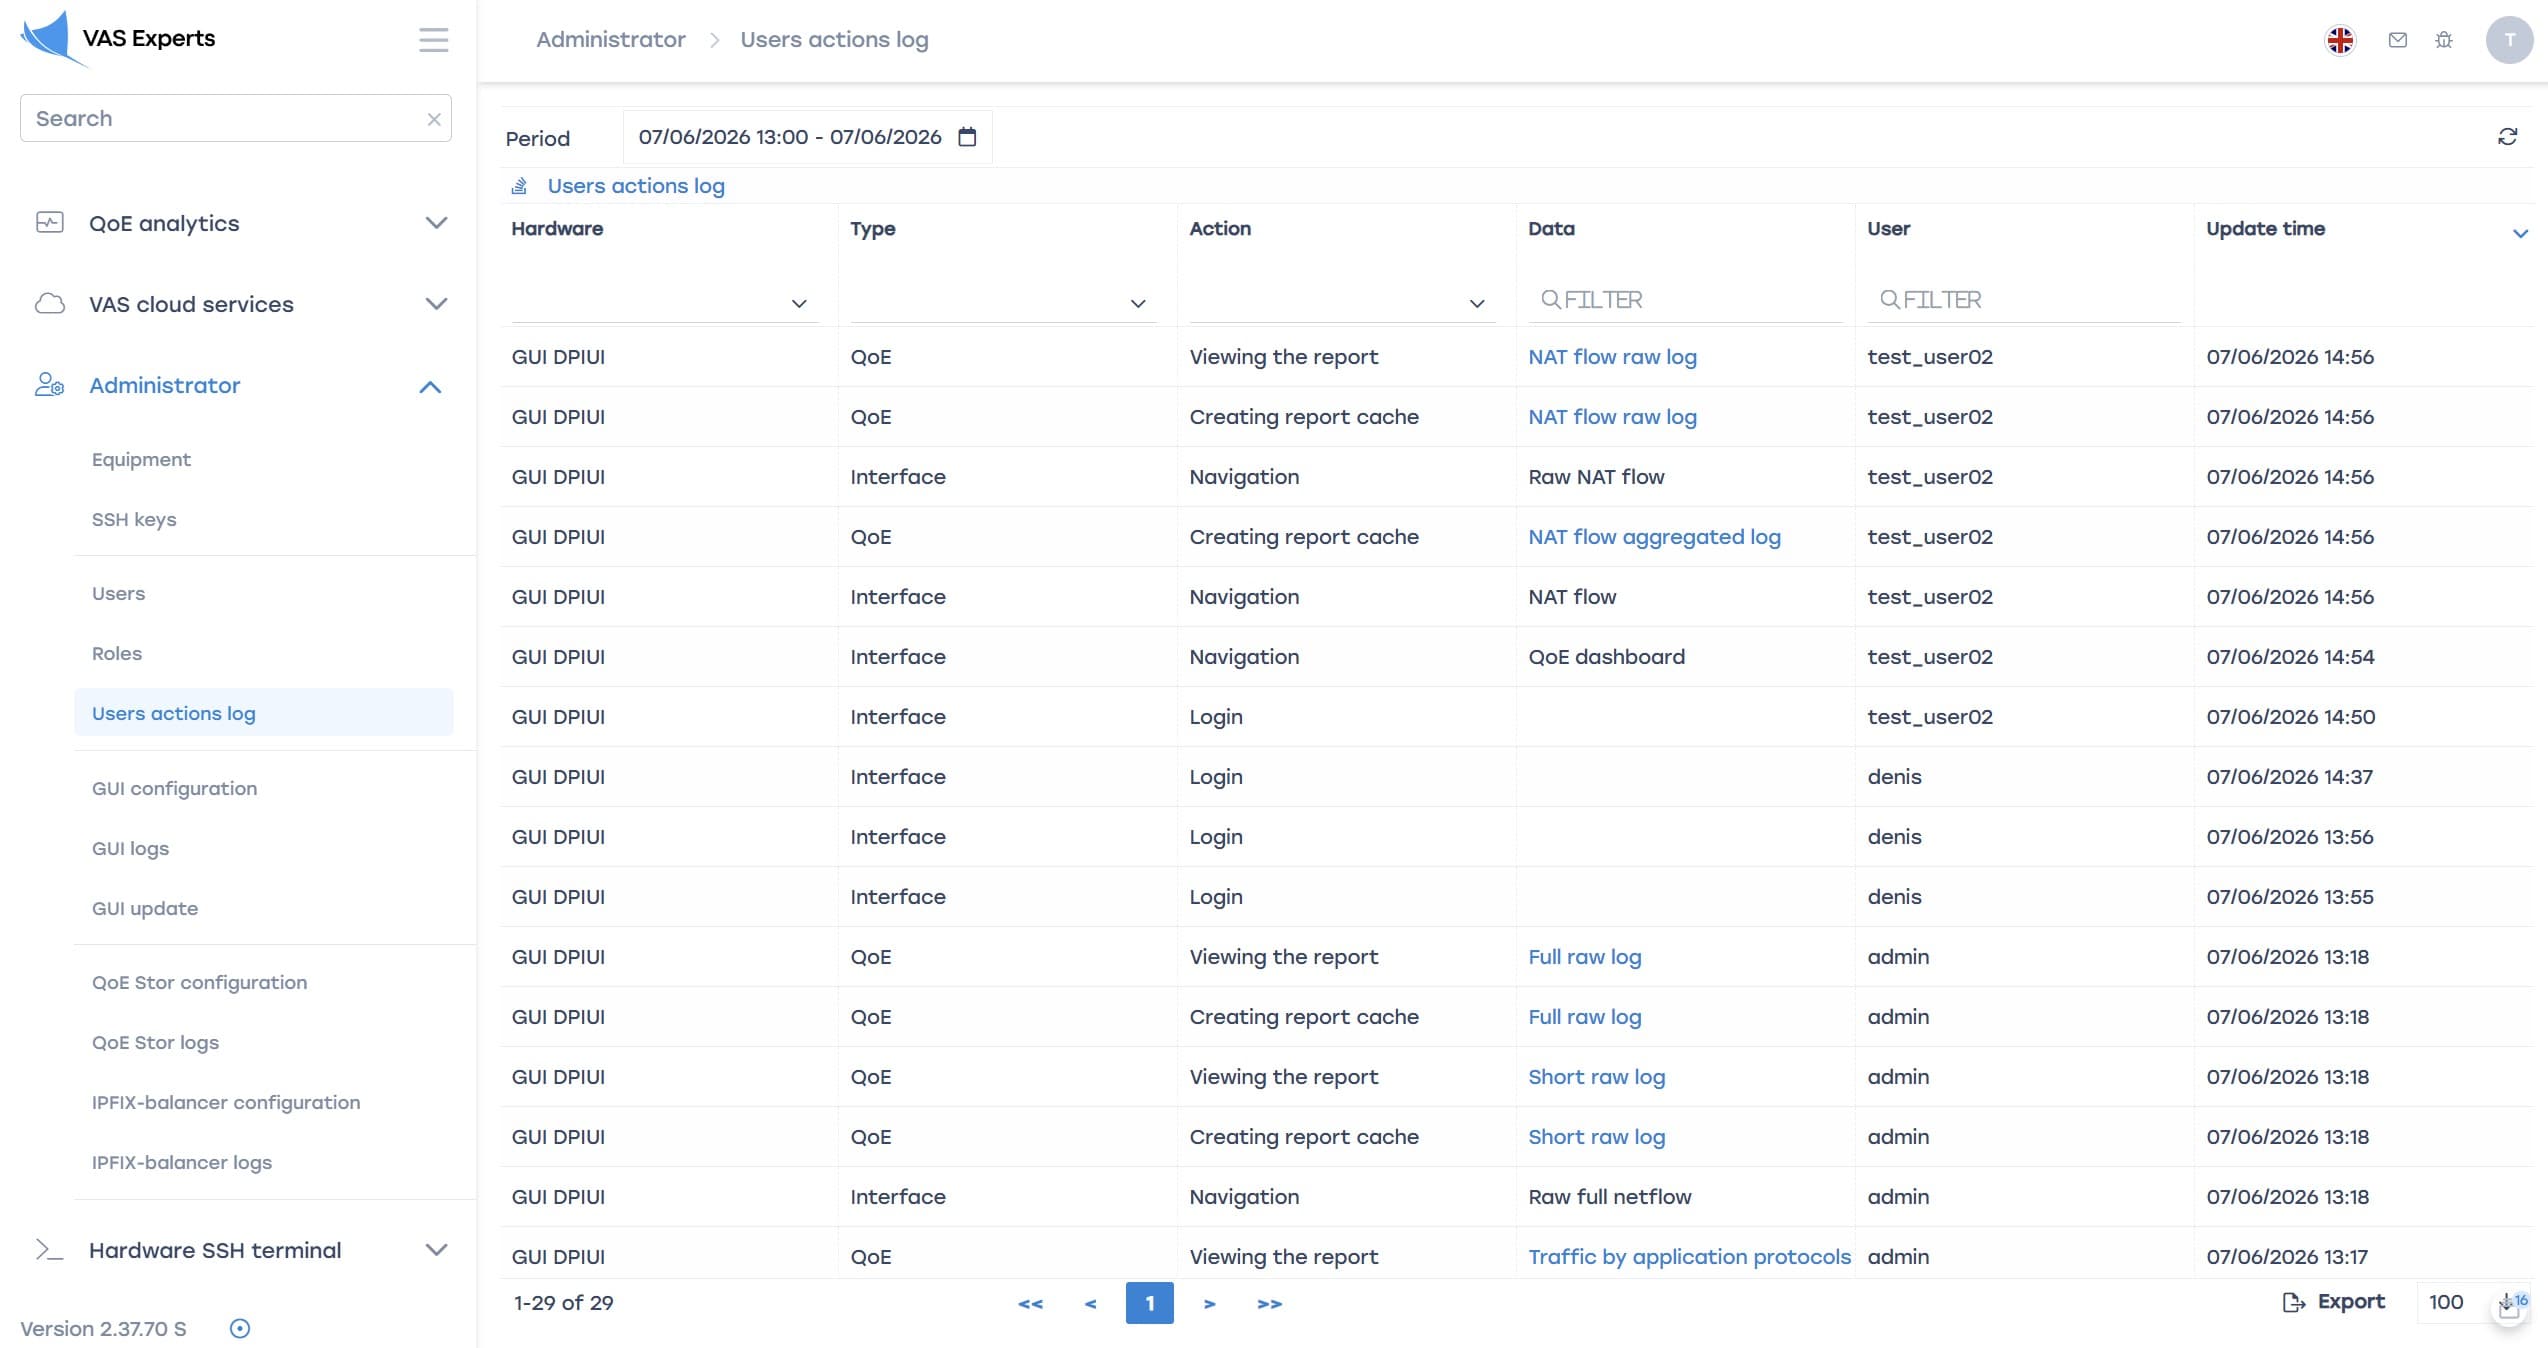
User action log
Conclusion
As operator infrastructure grows, managing network services stops being a task for individual teams and interfaces.
DPI, CG-NAT, BNG, QoE, mobile gateways, and other network functions form a single service platform, where changes in one component can affect the operation of related services.
Stingray NMS brings these components together into a common control loop. The system centralizes configurations, alarms, statistics, QoE, auditing, and integrations with external OSS/BSS platforms. As a result, network operations become more predictable: fewer manual operations during changes, faster incident localization, and more transparent auditing of staff actions.